Bitcoin Slides Below $74,000 as Analyst Flags Potential Drop to $44,000
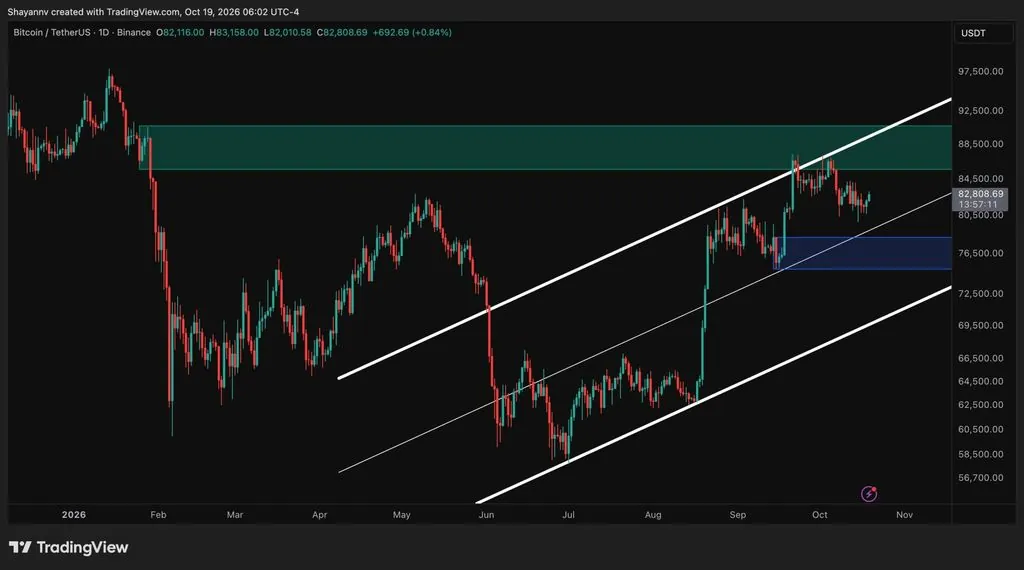
Bitcoin fell 3.2% to $73,240 in the past 24 hours, trading below a key support level that technical analyst Xanrox had flagged as critical. The analyst's Elliott Wave analysis suggests Bitcoin's bear market structure is 70% complete, with potential downside to $44,000 if support fails.
Written by CoinArticle’s AI Newsroom · from 1 cited source. How we work
Current Price Action and Technical Setup
Bitcoin traded at $73,240 on Tuesday, down 3.2% over the past 24 hours and now trading below the support level that analyst Xanrox had previously highlighted as significant. The move extends Bitcoin's decline from its October 2025 all-time high above $126,000, a drop of approximately 42% from that peak.
According to Xanrox, Bitcoin's chart exhibits three separate bearish flag formations across the daily timeframe: a small flag, a medium flag, and a larger flag currently developing around the present trading range. The analyst contends that this flag structure signals further downside risk.
Elliott Wave Interpretation and Downside Targets
Xanrox's analysis frames Bitcoin's price action since October as an ABC corrective pattern using Elliott Wave theory, with wave B now complete. Under this reading, Bitcoin's bear market structure is approximately 70% complete, with the remaining decline potentially reaching $44,000 if the current support level breaks.
The analysis does not provide a specific timeframe for reaching the lower target, only that the most significant losses may still lie ahead. Xanrox's warning emerged as Bitcoin struggled to sustain recovery attempts above $74,000.
Why It Matters
For Traders
A break below $73,240 would validate the bearish flag setup on daily charts and could accelerate liquidations on leveraged long positions if momentum deteriorates further.
For Investors
Technical analysis alone cannot predict price direction; this prediction rests on pattern interpretation without on-chain metrics, fundamental catalysts, or corroborating analyst consensus.
For Builders
Protocol-level developers should monitor Bitcoin sentiment shifts, but technical price targets have no direct bearing on Ethereum, Layer 2s, or application layer infrastructure.
This article is for information only and is not financial advice. Read the full disclaimer.