Bitcoin Falls 20% in Worst Week Since FTX Collapse
Bitcoin closed the week of June 5, 2026 down nearly 20%, marking its sharpest single-week decline since November 2022's FTX collapse. The drop from $73,760 weekly open to a low of $59,130 reflects institutional selling, ETF weakness, and a failed recovery attempt above $82,000.
Key Takeaways
- 1## Weekly Decline Echoes FTX-Era Volatility Bitcoin fell 19.
- 25% from the week of June 5's open to its intraweek low, according to TradingView data.
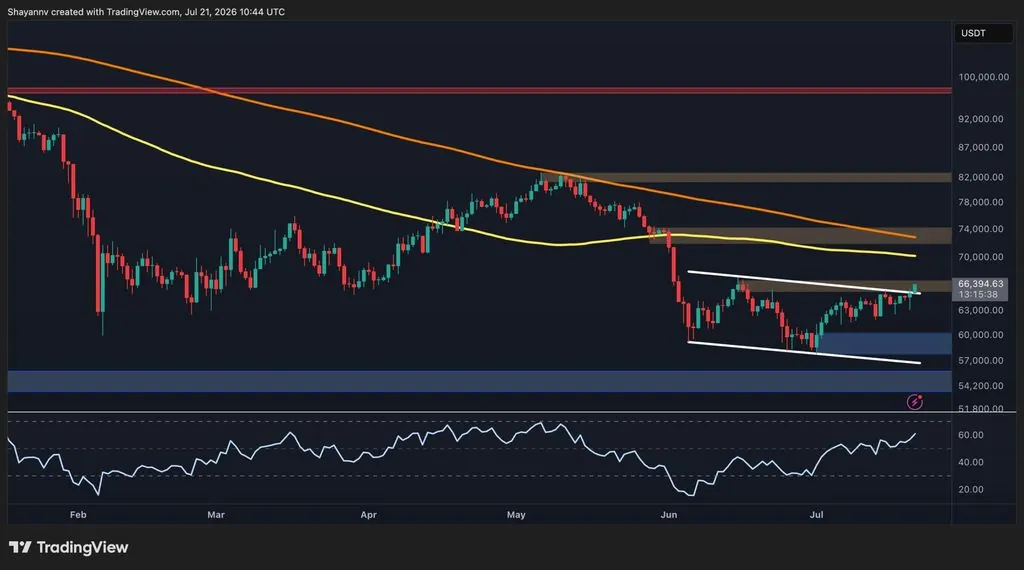
- 3The price opened near $73,760, briefly rose to $74,092, then descended to $59,130—a 20.
- 41% drop from peak to trough.
- 5The decline ranks as Bitcoin's worst weekly percentage move since the FTX collapse in November 2022, when BTC lost roughly 22% in a single week.
Weekly Decline Echoes FTX-Era Volatility
Bitcoin fell 19.5% from the week of June 5's open to its intraweek low, according to TradingView data. The price opened near $73,760, briefly rose to $74,092, then descended to $59,130—a 20.1% drop from peak to trough. The decline ranks as Bitcoin's worst weekly percentage move since the FTX collapse in November 2022, when BTC lost roughly 22% in a single week.
Context and Triggering Factors
The current selloff differs from the FTX crash in structure and narrative. While the FTX collapse struck after months of steady selling pressure and landed near the 2022 bear-market bottom, this week's drop occurs after Bitcoin has already lost significant value from its October 2025 all-time high above $126,000. The recent decline stems from a combination of institutional selling pressure, weakness in spot Bitcoin ETF flows, and failed momentum above $82,000 that exhausted buyer support.
Market Timing Questions
The comparison to FTX-era lows raises the question of whether Bitcoin is approaching cycle bottom or whether further downside remains. The current setup presents a more complicated picture than 2022, as BTC is reacting to multiple pressure vectors rather than a single catastrophic event.
Why It Matters
For Traders
A 20% weekly decline tests key support levels and may signal capitulation; watch for volume patterns and opening-range fills in the coming days.
For Investors
The depth of this drawdown from the October ATH ($126K to $59K range) suggests the current cycle structure differs materially from 2022; re-evaluate thesis durability.
For Builders
Sharp price declines often precede funding cuts and talent attrition; protocol teams should stress-test runway assumptions against extended low-volatility periods.