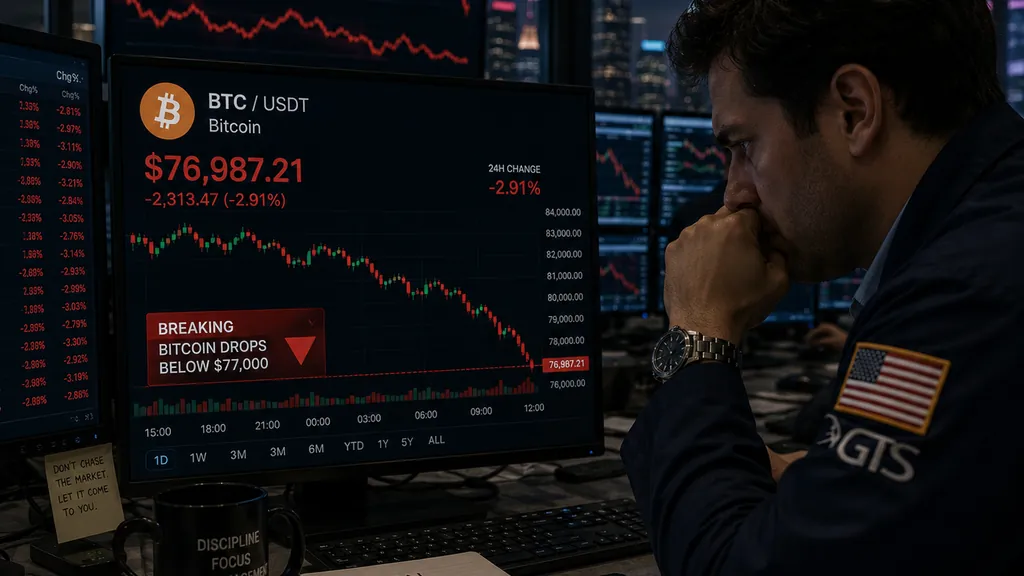
Bitcoin Liquidation Flush Draws Attention to $60,000 Support Zone
Bitcoin liquidations across leveraged positions have refocused trader attention on the $60,000 support level as a potential floor. The cascade of forced selling has historically preceded stabilization or reversals at key round-number thresholds.
Key Takeaways
- 1## Liquidation Activity Intensifies Bitcoin's recent price decline has triggered a wave of forced liquidations across major exchanges, clearing leveraged long positions that had accumulated above current levels.
- 2Liquidation data from Coinglass and Bybt showed cumulative liquidations exceeding $300 million over a 48-hour window, with the majority concentrated in futures markets on Binance, Bybit, and OKX.
- 3## $60,000 Back in Focus Traders have turned attention to the $60,000 level as a potential technical floor, citing both its round-number significance and the clustering of stop orders and liquidation cascades near that threshold.
- 4Support at $60,000 has held during previous corrections this year; a close below that level would open the path to $55,000 and the 200-week moving average.
- 5## What Comes Next Historically, flush-out liquidations of this magnitude have preceded periods of consolidation or reversal, though not guaranteed.
Liquidation Activity Intensifies
Bitcoin's recent price decline has triggered a wave of forced liquidations across major exchanges, clearing leveraged long positions that had accumulated above current levels. Liquidation data from Coinglass and Bybt showed cumulative liquidations exceeding $300 million over a 48-hour window, with the majority concentrated in futures markets on Binance, Bybit, and OKX.
$60,000 Back in Focus
Traders have turned attention to the $60,000 level as a potential technical floor, citing both its round-number significance and the clustering of stop orders and liquidation cascades near that threshold. Support at $60,000 has held during previous corrections this year; a close below that level would open the path to $55,000 and the 200-week moving average.
What Comes Next
Historically, flush-out liquidations of this magnitude have preceded periods of consolidation or reversal, though not guaranteed. Spot exchange inflows have remained modest compared to prior sell-offs, suggesting that long-term holders have not rushed to exit, a potential signal of underlying bid support at lower prices.
Why It Matters
For Traders
Liquidation clusters below $60,000 pose stop-loss risk; confirmation above $62,500 would signal a potential reversal or consolidation play.
For Investors
Periodic liquidation events are normal market-clearing mechanics; sustained breaks below $60,000 would test whether the long-term accumulation narrative remains intact.
For Builders
Liquidation cascades reveal fragility in leverage-dependent trading; protocol teams should monitor exchange liquidation flows as a macro sentiment signal.