Bitcoin RSI Suggests Market Bottom as Oversold Levels Resurface
Bitcoin's weekly RSI has plunged to oversold levels last seen at $15,000, signaling a potential turning point. As the market reacts to this significant technical indicator, traders and investors are keenly observing for signs of a reversal.
Key Takeaways
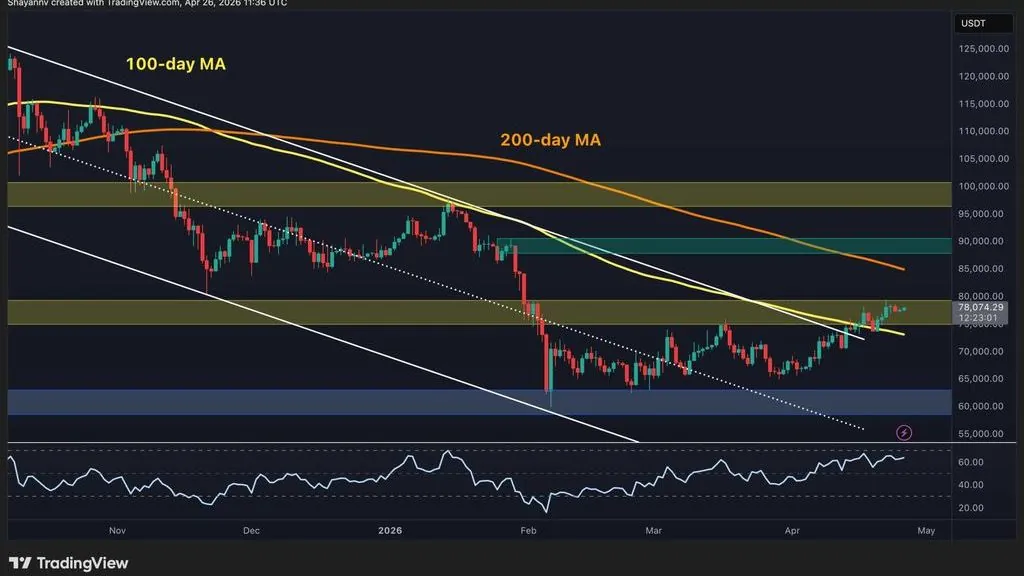
- 1## Bitcoin RSI Signals Potential Bottom as Market Reaches Extreme Oversold Levels Bitcoin's weekly Relative Strength Index (RSI) has plummeted into oversold territory not seen since the cryptocurrency traded around $15,000.
- 2This decline could indicate a pivotal market turning point for investors closely monitoring technical indicators.
- 3## Technical Indicators Flash Rare Signal The weekly RSI, a key momentum oscillator utilized by traders to gauge overbought and oversold conditions, has fallen to levels that historically foreshadowed major price reversals.
- 4This indicator's movement comes at a time when Bitcoin has experienced a significant pullback of 36% from its all-time peaks, marking one of the largest corrections within the current market cycle.
- 5Notably, the last instance of this specific RSI pattern was documented in early 2023, a period that eventually proved to be an advantageous accumulation zone for long-term investors.
Bitcoin RSI Signals Potential Bottom as Market Reaches Extreme Oversold Levels
Bitcoin's weekly Relative Strength Index (RSI) has plummeted into oversold territory not seen since the cryptocurrency traded around $15,000. This decline could indicate a pivotal market turning point for investors closely monitoring technical indicators.
Technical Indicators Flash Rare Signal
The weekly RSI, a key momentum oscillator utilized by traders to gauge overbought and oversold conditions, has fallen to levels that historically foreshadowed major price reversals. This indicator's movement comes at a time when Bitcoin has experienced a significant pullback of 36% from its all-time peaks, marking one of the largest corrections within the current market cycle.
Notably, the last instance of this specific RSI pattern was documented in early 2023, a period that eventually proved to be an advantageous accumulation zone for long-term investors. The indicator's drop into oversold territory suggests that selling pressure may be nearing exhaustion, potentially setting the stage for a market rebound.
Market Context and Historical Precedent
The current RSI readings are particularly noteworthy due to their rarity. When Bitcoin was last hovering around the $15,000 mark, market sentiment was overwhelmingly bearish, and the cryptocurrency sector was grappling with challenging macroeconomic conditions. However, the occurrence of similar technical signals at considerably higher price levels indicates a different market landscape, though selling intensity has reached comparable extremes when evaluated on a relative basis.
The 36% correction from Bitcoin's all-time high is substantial yet remains within the typical range observed during earlier Bitcoin bull cycles. The coincidence of this price decline with extreme RSI levels creates a technical scenario that has historically piqued buyer interest.
Implications for Market Participants
Technical analysts often regard oversold RSI conditions as potential inflection points rather than guaranteed reversal signals. While this indicator implies that downside momentum may be waning, market participants typically seek confirmation through price action and volume patterns before concluding that a bottom is in place.
Conclusion
Bitcoin's weekly RSI has arrived at a point of technical significance, mirroring conditions last seen when the cryptocurrency traded at much lower prices. While this development represents a critical insight for traders and analysts, the ultimate direction of the market will hinge on various factors beyond technical metrics alone. Traders and investors will be attentively observing whether this oversold signal results in sustained buying pressure in the days ahead.
Why It Matters
For Traders
Traders should watch for confirmation of potential reversal signals through price action and volume to capitalize on potential upward momentum following this RSI dip.
For Investors
Long-term investors may view this oversold RSI signal as a strategic opportunity for accumulation, particularly if historical patterns are indicative of future trends.
For Builders
Developers should consider the implications of market sentiment shifts, as price action influenced by these technical signals can lead to increased trading volume and user engagement within their projects.