Hyperliquid Overtakes Solana by Fully Diluted Valuation
Hyperliquid's fully diluted valuation reached approximately $54.57 billion, exceeding Solana's $54.22 billion FDV according to Arkham data. The milestone underscores the growing competition among application-focused, revenue-generating blockchain networks.
Key Takeaways
- 1## The FDV Crossover Hyperliquid's fully diluted valuation briefly exceeded Solana's on a per-token basis, according to blockchain data platform Arkham.
- 2HYPE traded near $56.
- 371 with an FDV of roughly $54.
- 457 billion against a max supply of 962.
- 527 million tokens, while SOL traded around $86.
The FDV Crossover
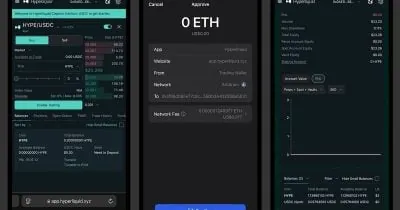
Hyperliquid's fully diluted valuation briefly exceeded Solana's on a per-token basis, according to blockchain data platform Arkham. HYPE traded near $56.71 with an FDV of roughly $54.57 billion against a max supply of 962.27 million tokens, while SOL traded around $86.51 with an FDV of approximately $54.22 billion against a max supply of 626.75 million tokens. The gap between the two networks' circulating market capitalizations remained wide—Hyperliquid at $13.28 billion and Solana at $49.99 billion—reflecting HYPE's significantly lower circulating supply of 238.39 million tokens versus SOL's 577.86 million.
What Drives the Comparison
The FDV metric has become a key reference point in discussions of "revenue chains"—networks designed to capture transaction fees and other protocol revenue directly from their core applications rather than relying primarily on user growth and token appreciation. Hyperliquid operates as a decentralized perpetual futures exchange and is among the highest-grossing protocols by weekly revenue, competing with Solana's own ecosystem of DeFi applications. Both networks attract capital partly on the premise that they can distribute meaningful economic value to token holders through protocol revenue and fee generation.
Why It Matters
For Traders
FDV comparisons are sensitive to max supply and token price; traders should verify circulating supply dilution timelines before weighting this metric heavily in position sizing.
For Investors
The comparison highlights a structural shift toward protocols that generate measurable on-chain revenue; FDV parity between a DeFi app and a Layer 1 base chain signals market repricing of economic models.
For Builders
Revenue-focused chain design is increasingly competitive; teams shipping on or building alternative chains should model fee distribution and token unlock schedules against established precedents.