Mastering Crypto Trading: Harnessing Technical Analysis and Bots
Unlock the power of technical analysis and automated trading in the volatile cryptocurrency market. Learn how to effectively use key indicators like RSI and MACD for informed trading decisions with trading bots like Cryptohopper.
Key Takeaways
- 1## Introduction to Technical Analysis & Automated Trading The cryptocurrency market never sleeps—and neither does its legendary volatility.
- 2While this 24/7 trading environment creates opportunities, it also presents challenges for traders trying to make informed, data-driven decisions without burning out.
- 3This is where technical analysis becomes essential, providing a systematic method for predicting price movements based on historical patterns and market data.
- 4Technical analysis examines past price action and volume to forecast future trends, offering traders a framework beyond speculation.
- 5When combined with trading bots—automated tools like Cryptohopper that execute strategies based on predefined rules—technical analysis becomes a powerful engine for consistent, emotion-free trading.
Introduction to Technical Analysis & Automated Trading
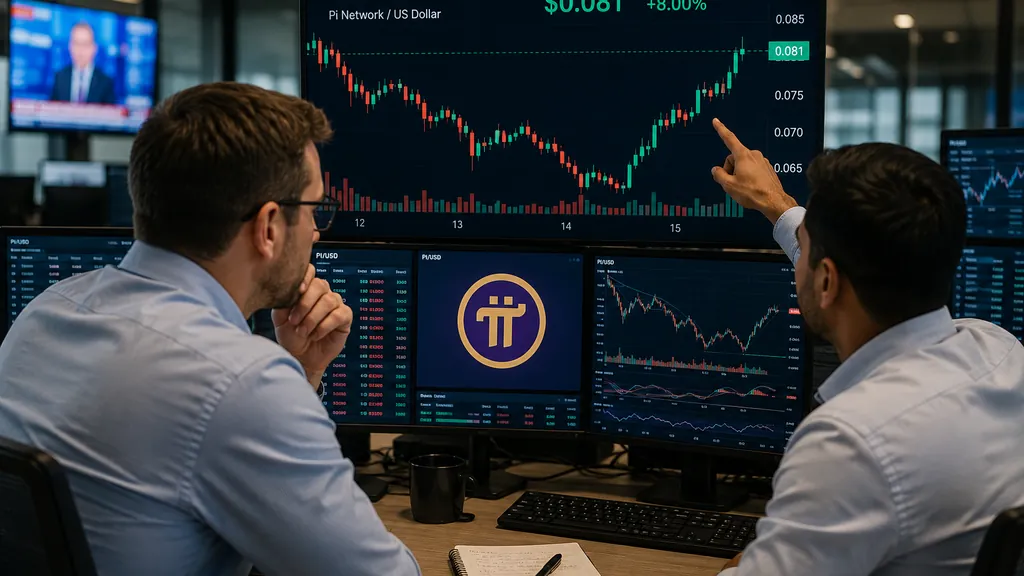
The cryptocurrency market never sleeps—and neither does its legendary volatility. While this 24/7 trading environment creates opportunities, it also presents challenges for traders trying to make informed, data-driven decisions without burning out. This is where technical analysis becomes essential, providing a systematic method for predicting price movements based on historical patterns and market data.
Technical analysis examines past price action and volume to forecast future trends, offering traders a framework beyond speculation. When combined with trading bots—automated tools like Cryptohopper that execute strategies based on predefined rules—technical analysis becomes a powerful engine for consistent, emotion-free trading. But understanding how these bots interpret indicators is crucial to leveraging their full potential.
The Foundation: Understanding Technical Indicators
Technical indicators are mathematical calculations derived from price and volume data. Think of them as the trader's toolkit for making sense of market chaos. Rather than relying on gut feelings, indicators transform raw market data into actionable insights.
Their primary purpose is threefold: identifying trends (is the market moving up or down?), measuring momentum (how strong is the movement?), and spotting potential reversal points (when might the trend change?). These insights generate trading signals—specific conditions that suggest when to buy or sell an asset.
For both human traders and automated systems, technical indicators serve as the foundation for systematic decision-making. They help filter market noise and focus on statistically significant patterns that have historically preceded price movements.
Key Indicators for Crypto: RSI & MACD Explained
Relative Strength Index (RSI)
The RSI is a momentum oscillator ranging from 0 to 100 that identifies overbought or oversold conditions in crypto assets. Calculated by comparing the magnitude of recent gains to recent losses over a specific period (typically 14 days), RSI helps traders spot potential reversals.
Traditionally, an RSI above 70 suggests an asset may be overbought (potentially due for a correction), while below 30 indicates oversold conditions (possibly undervalued). In volatile crypto markets, however, traders often adjust these thresholds to 80/20 to account for extended trends.
Moving Average Convergence Divergence (MACD)
MACD measures trend strength, direction, and momentum by showing the relationship between two moving averages of an asset's price—typically the 12-period and 26-period exponential moving averages. The MACD line, signal line, and histogram work together to reveal shifting market dynamics.
When the MACD line crosses above the signal line, it generates a bullish signal; crossing below indicates bearish momentum. The histogram's expanding or contracting bars visually represent momentum strength, making MACD particularly useful for confirming trends.
Many successful traders use RSI and MACD together, waiting for both to align before acting—creating stronger, more reliable trading signals than either indicator alone.
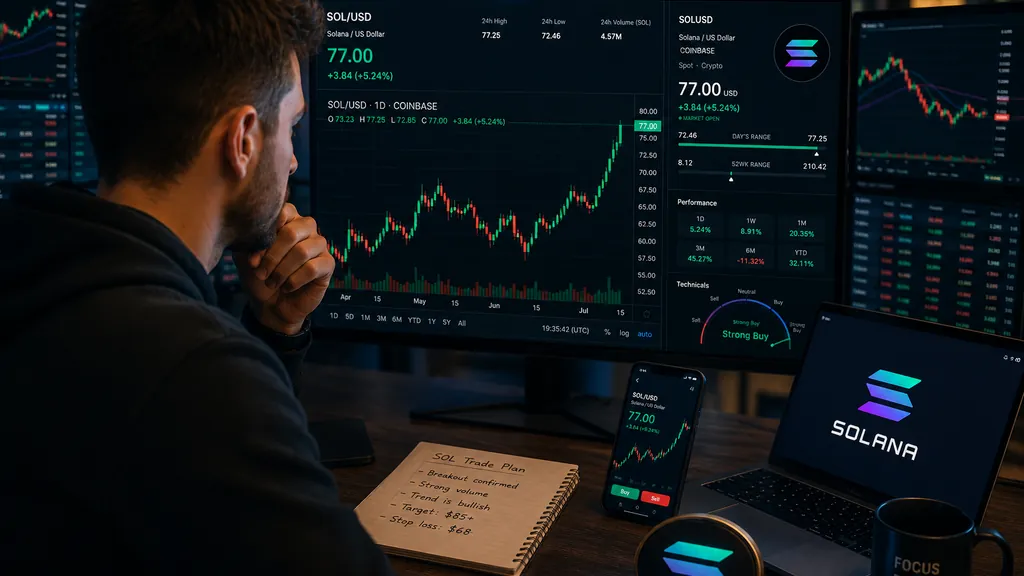
How Cryptohopper Bots Leverage Indicators for Trading Signals
Trading bots interpret technical indicators through configurable rules and thresholds. For example, a bot might be programmed to buy Bitcoin when RSI drops below 30 AND MACD shows a bullish crossover—combining two signals for higher confidence.
Platforms like Cryptohopper, alongside competitors such as 3Commas and TradeSanta, allow traders to implement technical analysis strategies without coding knowledge. You configure which indicators to monitor, set threshold values, and define how the bot should respond when conditions are met. The bot then executes these rules with precision, continuously monitoring markets.
The benefits are compelling: bots provide 24/7 market surveillance, eliminate emotional decision-making (fear and greed often sabotage manual trading), and offer backtesting capabilities to validate strategies against historical data before risking real capital.
Maximizing Your Bot's Performance and Conclusion
While indicators are powerful, they're not crystal balls. Each has limitations—RSI can stay overbought during strong trends, and MACD may lag during rapid price movements. This is why combining multiple indicators and understanding their weaknesses is essential.
Success requires careful strategy development, rigorous backtesting across different market conditions, and continuous optimization. Market dynamics shift, so strategies that worked last month may need adjustment today. Platforms like Cryptohopper facilitate this iterative process, but the responsibility for strategy quality remains with the trader.
Key takeaways: Trading bots are sophisticated tools that execute technical analysis strategies with consistency and discipline. However, they require human oversight, thoughtful configuration, and ongoing refinement. Master the indicators first, understand their signals, then let automation amplify your edge—not replace your judgment.
How to Try This on Cryptohopper
- Sign up for a Cryptohopper account and connect your crypto exchange.
- Configure your bot by selecting the RSI and MACD indicators and setting threshold values for buy/sell triggers.
- Backtest your strategy against historical market data to ensure robustness before deploying it live.
- Monitor your bot’s performance and refine your strategy as market conditions change.
Why It Matters
For Traders
Understanding technical analysis equips traders with objective tools to navigate market volatility, enabling them to make informed decisions rather than relying on instinct.
For Investors
Long-term investors can utilize insights from technical indicators to strategically enter or exit positions, ensuring their investment strategies align with market cycles.
For Builders
Developers creating trading bots or analytics tools can leverage enhanced understanding of indicators to build more effective solutions that meet traders' needs.
Disclosure: This is educational content. Always do your own research before trading.