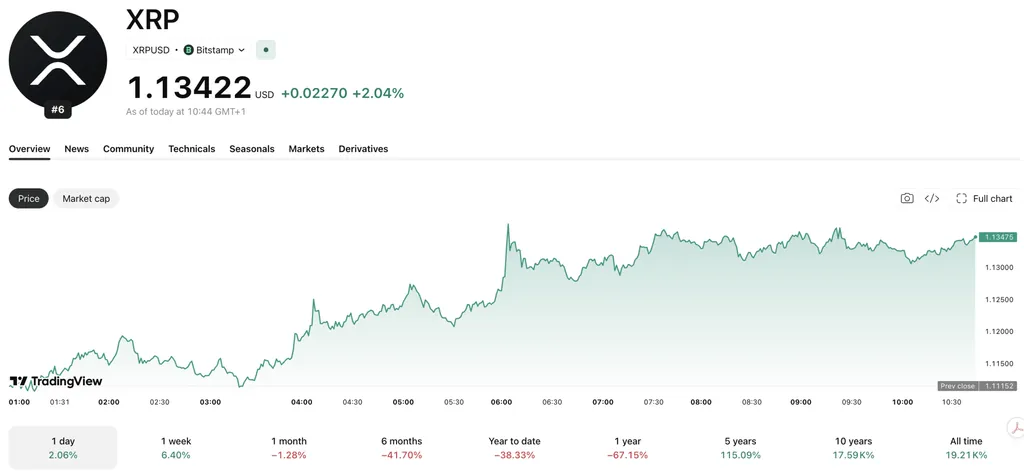
XRP Analyst Points to Falling Wedge Pattern Ahead of Potential Rally
Crypto analyst Blacksea identified a falling wedge pattern in XRP's price action that mirrors a setup from early 2024, which preceded a 600% rally. If the pattern repeats, XRP could experience a similar parabolic move, though past performance does not guarantee future results.
Key Takeaways
- 1## Pattern Identified Analyst Blacksea noted on June 6 that XRP has formed a falling wedge pattern identical to one that emerged in early 2024.
- 2A falling wedge is a technical chart structure marked by tightening price swings between converging upper and lower trendlines, often followed by a breakout move.
- 3During the 2024 instance, XRP traded around $0.
- 450 as the wedge compressed.
- 5The pattern included a brief false breakdown below the lower boundary before price reversed sharply higher, eventually reaching $1.
Pattern Identified
Analyst Blacksea noted on June 6 that XRP has formed a falling wedge pattern identical to one that emerged in early 2024. A falling wedge is a technical chart structure marked by tightening price swings between converging upper and lower trendlines, often followed by a breakout move.
During the 2024 instance, XRP traded around $0.50 as the wedge compressed. The pattern included a brief false breakdown below the lower boundary before price reversed sharply higher, eventually reaching $1.50 and delivering a 600% gain.
Current Setup
Blacksea contends that XRP is now repeating the same technical formation. According to the analyst's assessment, the current pattern could precede another significant rally if historical price action repeats. The analyst framed the setup as overlooked by the broader market despite its potential significance.
No specific price target or timeline for a breakout was provided in the available commentary. The analyst's claim rests on the observation that two similar technical patterns should produce comparable outcomes.
Why It Matters
For Traders
Technical pattern recognition can inform entry and exit decisions, though single-chart indicators carry risk; traders should verify the pattern across multiple timeframes and validate support/resistance levels independently.
For Investors
Chart pattern analysis alone has limited predictive power over multi-month horizons; fundamental factors including regulatory clarity and XRP adoption typically drive longer-term price direction.
For Builders
On-chain metrics and protocol adoption are more reliable signals than technical analysis for assessing whether a network is attracting genuine utility and developer activity.