XRP Chart Signals Bullish Momentum with Emerging Triangle Pattern
XRP's price charts are revealing a bullish triangle pattern, indicating potential upward movement to $2 by early 2026. Traders and investors should closely monitor key support and resistance levels for breakout confirmation.
Key Takeaways
- 1## Technical Pattern Emerges on XRP Charts XRP, one of the cryptocurrency market's most closely watched digital assets, has developed a significant technical formation that has captured the attention of traders and analysts.
- 2The cryptocurrency's price chart now displays a bull triangle pattern, a technical indicator that historically suggests the potential for upward price movement.
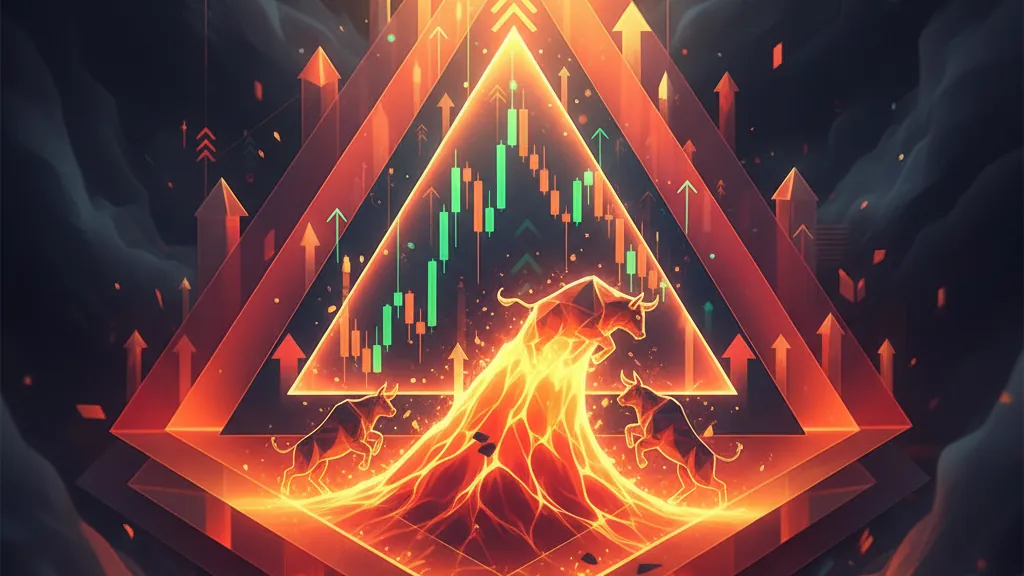
- 3## Understanding the Bull Triangle Formation The bull triangle pattern forming on XRP's chart signifies a consolidation phase, where the asset's price consistently establishes a series of higher lows while encountering resistance at a relatively flat upper boundary.
- 4This formation is typically interpreted by chartists as a continuation pattern, suggesting the likelihood of bullish price action.
- 5Current technical analysis indicates that this pattern is pointing toward a potential breakout that could drive XRP's price to the $2 level.
Technical Pattern Emerges on XRP Charts
XRP, one of the cryptocurrency market's most closely watched digital assets, has developed a significant technical formation that has captured the attention of traders and analysts. The cryptocurrency's price chart now displays a bull triangle pattern, a technical indicator that historically suggests the potential for upward price movement.
Understanding the Bull Triangle Formation
The bull triangle pattern forming on XRP's chart signifies a consolidation phase, where the asset's price consistently establishes a series of higher lows while encountering resistance at a relatively flat upper boundary. This formation is typically interpreted by chartists as a continuation pattern, suggesting the likelihood of bullish price action.
Current technical analysis indicates that this pattern is pointing toward a potential breakout that could drive XRP's price to the $2 level. However, analysts emphasize that this price target is projected for early 2026, suggesting a longer-term outlook rather than an immediate price surge.
Market Analysis and Key Levels
Cryptocurrency experts are currently engaged in comprehensive analysis of XRP's critical support and resistance levels. These technical thresholds will play a vital role in determining whether the anticipated breakout materializes as the pattern suggests. Analysts are also examining various market catalysts that could influence XRP's price trajectory in the coming months.
Identifying these key levels is essential for traders looking to position themselves ahead of potential price movements. Market participants typically monitor such technical patterns alongside fundamental developments that could act as triggers for the expected breakout.
Implications for Market Participants
The emergence of this bull triangle pattern offers market participants a defined technical framework for tracking XRP's price development. While technical patterns provide historical insights, they represent only one aspect of a comprehensive market analysis rather than definitive predictions.
Traders and investors following XRP will keenly observe whether the cryptocurrency can maintain the structure of the pattern and ultimately break above the triangle's upper resistance. The extended timeline to early 2026 underscores the need for patience for those positioning themselves based on this technical setup.
Conclusion
The bull triangle pattern on XRP's chart symbolizes a noteworthy technical development in the cryptocurrency landscape. With a potential price target of $2 projected for early 2026, market participants have a clear technical framework to monitor in the coming months. As with all forms of technical analysis, confirmation through actual price action and supporting market conditions will be essential to validate the implications of this pattern.
Why It Matters
For Traders
The bull triangle formation provides a tactical framework to identify potential entry and exit points, allowing traders to capitalize on significant price movements in XRP.
For Investors
Long-term investors can utilize this bullish signal as a reason to evaluate their positions in XRP, especially given the projected price target set for 2026, potentially enhancing their investment strategy.
For Builders
Developers and builders in the cryptocurrency space can use the insights gained from XRP's technical patterns to inform their projects, particularly those focusing on liquidity solutions or integrations with XRP-based ecosystems.