XRP's Descending Wedge Pattern Points to Potential Volatility Ahead
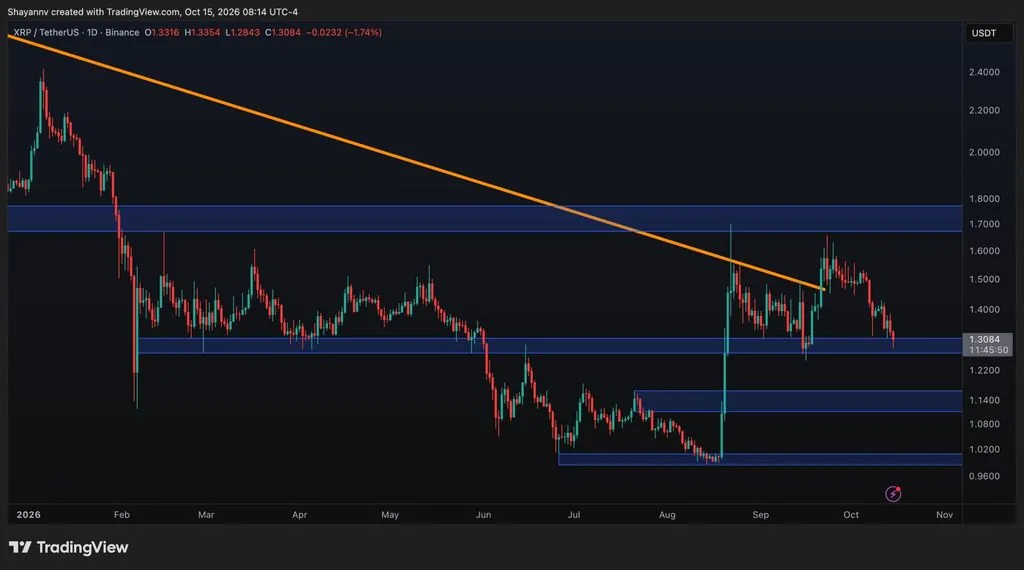
XRP is trading within a descending broadening wedge pattern formed since its July peak of $3.65, according to technical analysis by Egrag Crypto. The pattern carries a 57% probability of upside resolution but currently favors downward pressure in the near term.
Written by CoinArticle’s AI Newsroom · from 1 cited source. How we work
The Wedge Formation
XRP has traced lower highs since the start of 2025, extending a correction from its July peak at $3.65. This price action has formed a descending broadening wedge on higher-timeframe charts, characterized by expanding volatility constrained within downward-sloping boundaries, according to analysis by Egrag Crypto. The analyst noted the formation is not random and historically has preceded "final capitulation then violent expansion."
Probability Split and Near-Term Outlook
Egrag Crypto's technical work assigns the pattern a 57% probability of upside resolution against a 43% probability of further downside. Current price action is skewed toward a downward move, leading the analyst to characterize the present phase as short-term bearish compression. The analysis identifies one critical support level and a specific price threshold required for bullish confirmation, though neither is specified in the available data.
What This Pattern Historically Signals
Descending broadening wedges often emerge during late-stage accumulation phases rather than signaling outright weakness. The expanding volatility within downward boundaries can precede a directional breakout once constraint resolves. Traders monitoring XRP will be watching for either a move below key support, which could trigger further capitulation selling, or a break above the upper wedge boundary needed to confirm the bullish case.
Why It Matters
For Traders
XRP traders should identify the named support and resistance levels to plan stop-loss and entry points; the wedge suggests imminent volatility regardless of direction.
For Investors
A multi-month technical pattern does not alter XRP's fundamental value proposition or regulatory status; patience through compression phases is standard for long-horizon positions.
For Builders
Technical price patterns have no bearing on protocol development, interoperability upgrades, or the infrastructure built on XRP Ledger.
This article is for information only and is not financial advice. Read the full disclaimer.