Analyst Points to Head-and-Shoulders Pattern, Flags $52,000 Bitcoin Risk
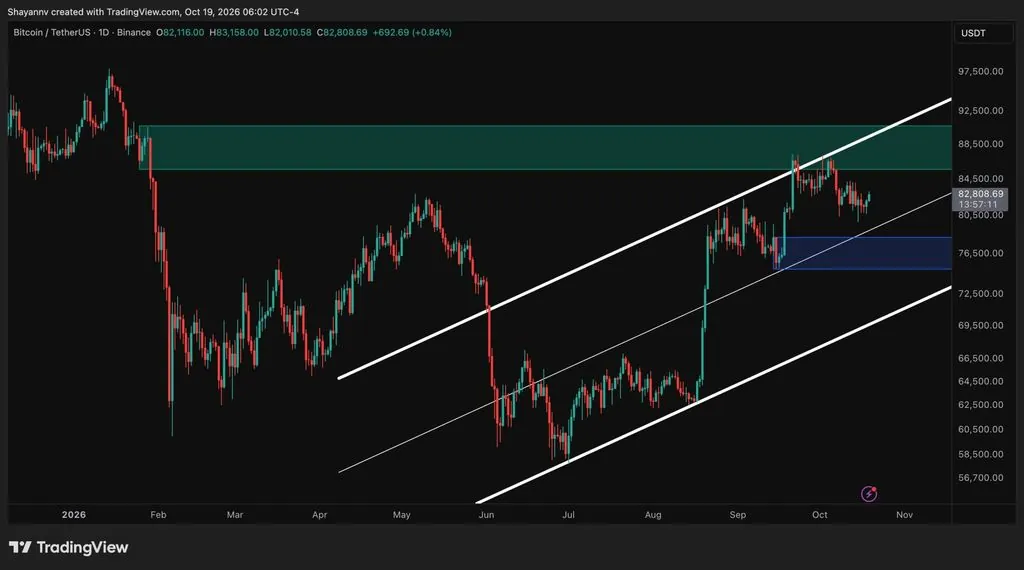
A crypto analyst identified as NoName on X warned Tuesday that Bitcoin's chart shows a Head-and-Shoulders formation, citing technical weakness after recent rejection at $82,000. The pattern suggests potential downside pressure toward $52,000 if bearish momentum persists, though Head-and-Shoulders predictions carry inherent uncertainty.
Written by CoinArticle’s AI Newsroom · from 1 cited source. How we work
The Technical Setup
Crypto analyst NoName flagged a Head-and-Shoulders formation on Bitcoin's chart that has been developing since 2024, extending even after BTC reached an all-time high above $126,000 in October. According to the analyst, Bitcoin completed the right shoulder of the pattern and experienced a failed breakdown, after which price began climbing back toward the $100,000 level.
Recent Price Action and Rejection
NoName noted that traders turned bullish as Bitcoin bounced from the $70,000 range, but the rally lost momentum when price approached the $82,000 resistance level. The rejection at $82,000, the analyst argued, confirmed underlying weakness in the cryptocurrency's structure and suggested further downside risk.
What the Pattern Implies
Head-and-Shoulders is a technical pattern often associated with trend reversals and bearish momentum. If the pattern plays out as the analyst suggests, Bitcoin could face pressure toward $52,000. Technical analysis of this kind relies on historical price patterns and is not guaranteed to predict future price movement; market outcomes depend on order flow, macro conditions, and sentiment shifts that charts alone cannot capture.
Why It Matters
For Traders
A chart-based downside target of $52,000 is in circulation; traders with long positions above that level should consider their risk tolerance and stop-loss placement.
For Investors
Single-analyst technical calls carry low predictive weight; multi-timeframe macro and on-chain data remain more reliable guides to directional risk.
For Builders
No protocol, governance, or infrastructure change is implied by a price-prediction thread; this is market sentiment only and does not affect the surface builders operate on.
This article is for information only and is not financial advice. Read the full disclaimer.