Bitcoin Struggles Against Upper Trendline Resistance Near $75,000
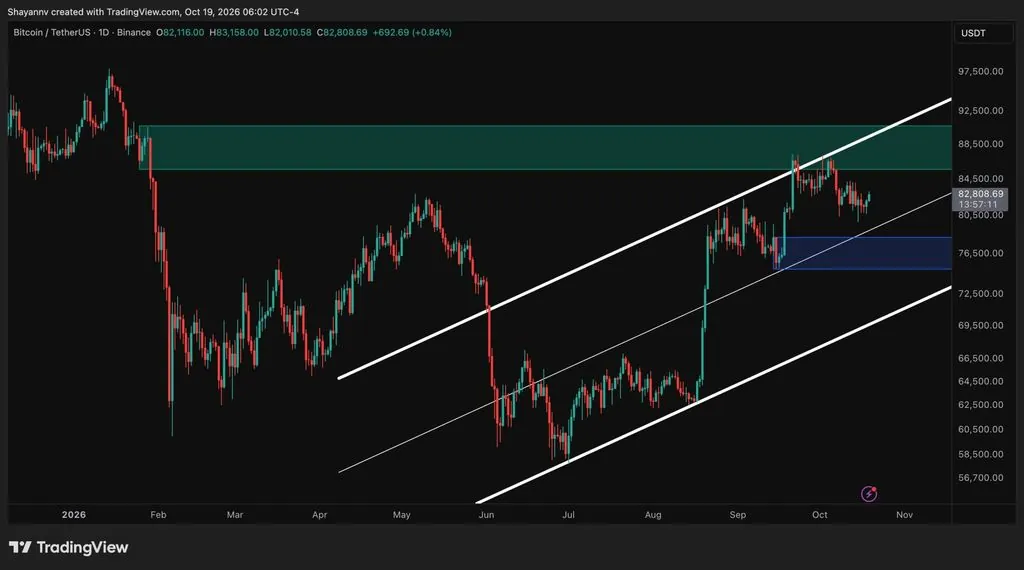
Bitcoin has repeatedly failed to break above an upper trendline resistance that overlaps with Fibonacci retracement levels, according to TradingView technical analysis. Analysts are watching the $73,000 to $75,000 support zone as critical for maintaining the broader bullish structure.
Written by CoinArticle’s AI Newsroom · from 1 cited source. How we work
Resistance Level Constraining Price Action
Bitcoin remains trapped beneath an upper trendline that has consistently rejected recovery attempts, according to technical analysis shared on TradingView. The resistance area coincides with key Fibonacci retracement levels, making it a significant barrier in the current market structure. Recent price action shows BTC slipping lower after another rejection near the top of the rising formation.
Support Zone Now in Focus
Analysts are directing attention to the $73,000 to $75,000 support region as critical for preserving the broader bullish structure. Bitcoin has recently formed a narrowing wedge-like recovery pattern following an earlier selloff, but rather than breaking upward decisively, BTC has begun rolling over near resistance again. This weakness suggests the market currently lacks sufficient momentum to overcome the upper trendline.
Chart Structure Remains Intact
Despite the repeated rejections at resistance, the overall chart structure has not yet broken down decisively. The narrowing formation indicates a period of consolidation, though the direction of the breakout remains uncertain. How Bitcoin behaves around the $73,000 to $75,000 support zone will likely determine whether the asset can eventually overcome the resistance above or faces further downside pressure.
Why It Matters
For Traders
Traders holding long positions should monitor the $73,000-$75,000 support zone closely, as a break below could accelerate selling pressure toward lower levels.
For Investors
A sustained break below this support would suggest the current rally lacks structural conviction, though long-term trend investors typically ignore intraday trendline rejections.
For Builders
This is a price-analysis article with no direct technical or product implications for protocol developers or infrastructure teams.
This article is for information only and is not financial advice. Read the full disclaimer.