Ethereum Trades Near $2,120 as 100-Day Moving Average Becomes Key Resistance
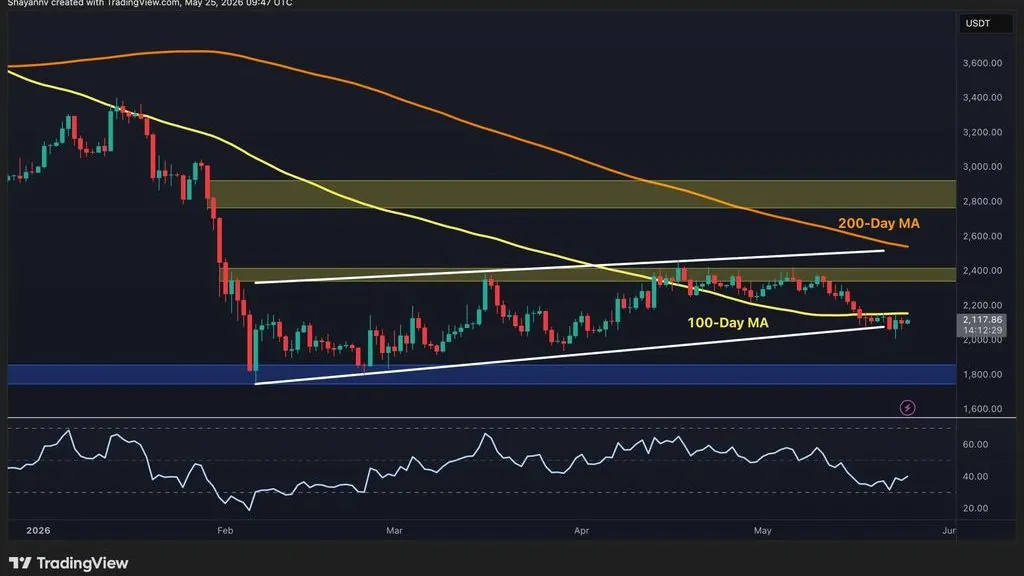
Ethereum is trading around $2,120 at the start of the final week of May, oscillating near its 100-day moving average after losing the level again during May's market decline. The moving average has become a focal point for price action as the asset struggles to establish directional momentum.
Written by CoinArticle’s AI Newsroom · from 1 cited source. How we work
Current Price Action
Ethereum is trading at $2,120 as the final week of May begins, hovering near its 100-day moving average. The asset briefly reclaimed the moving average in late April for the first time since the broader correction began, but surrendered it again during May's market breakdown.
Technical Resistance at the Moving Average
The 100-day moving average has become a critical technical level, acting as both resistance and a barometer for the broader market cycle. ETH's repeated moves above and below this level reflect the lack of sustained directional conviction in the market. The $2,000 support level is also being watched as a potential floor if selling pressure intensifies.
Market Sentiment and Cycle Dynamics
The back-and-forth price action underscores the frustration many participants feel about current market conditions. Without a clear break above or below key technical levels, traders are left to manage positions in a range-bound environment, with neither bulls nor bears able to establish sustained control.
Why It Matters
For Traders
A break below $2,000 or above the 100-day MA in the next 24-72 hours could signal which direction momentum breaks; position sizing accordingly may reduce whipsaw risk.
For Investors
Extended consolidation near key moving averages typically precedes either a confirmed trend or a deeper drawdown; the multi-week range itself is the data point worth monitoring.
For Builders
Volatile price action near support levels does not directly affect protocol development, but sustained weakness can shift community sentiment and fundraising conditions for new projects.
This article is for information only and is not financial advice. Read the full disclaimer.