Ethereum Charts Signal Bullish Trends for 2026 Rally
Technical analysis reveals bullish patterns in Ethereum's price chart, potentially indicating an 80% surge by 2026. Investors are encouraged to monitor these developments closely.
Written by CoinArticle’s AI Newsroom · from 1 cited source. How we work
Technical Patterns Signal Potential Ethereum Upside
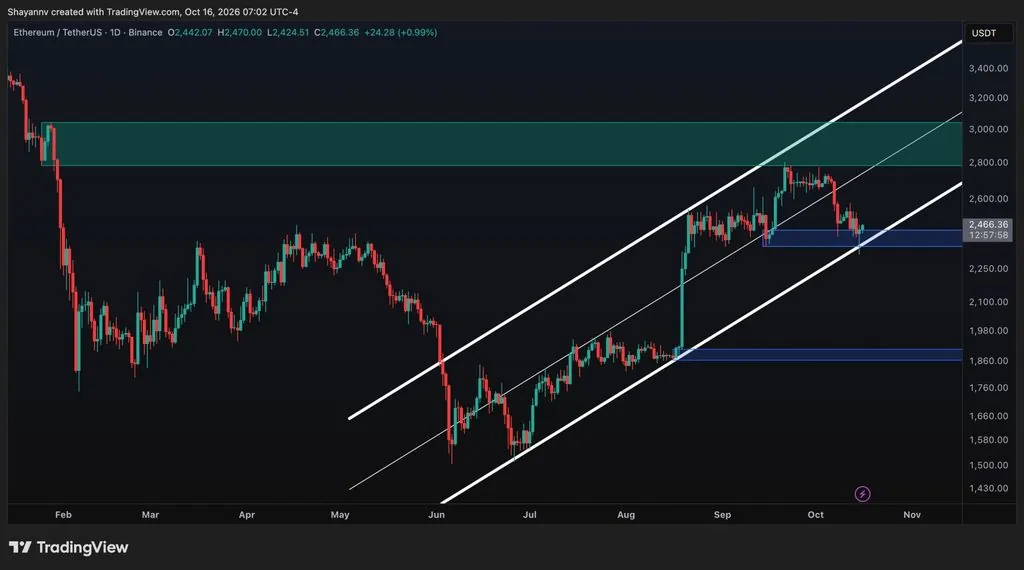
Ethereum, the world's second-largest cryptocurrency by market capitalization, appears poised for a significant price surge in 2026, backed by recent technical analysis. Market observers have identified pivotal chart patterns that historically precede major rallies, suggesting ETH could appreciate by as much as 80% over the coming years.
Inverse Head-and-Shoulders Formation
The bullish outlook centers around the emergence of an inverse head-and-shoulders pattern on Ethereum's price chart. This classic technical formation is a well-recognized indicator among traders, often signaling the shift from a downtrend to an uptrend. The pattern consists of three troughs, with the middle trough, referred to as the
This article is for information only and is not financial advice. Read the full disclaimer.