Ethereum Shows Early Signs of Weakening Bearish Momentum on Daily RSI
Ethereum's price action is displaying signs of potential seller exhaustion on the daily timeframe, with RSI divergence suggesting bearish momentum may be losing strength. The broader downtrend remains intact, but technical indicators point to a possible deceleration in selling pressure.
Key Takeaways
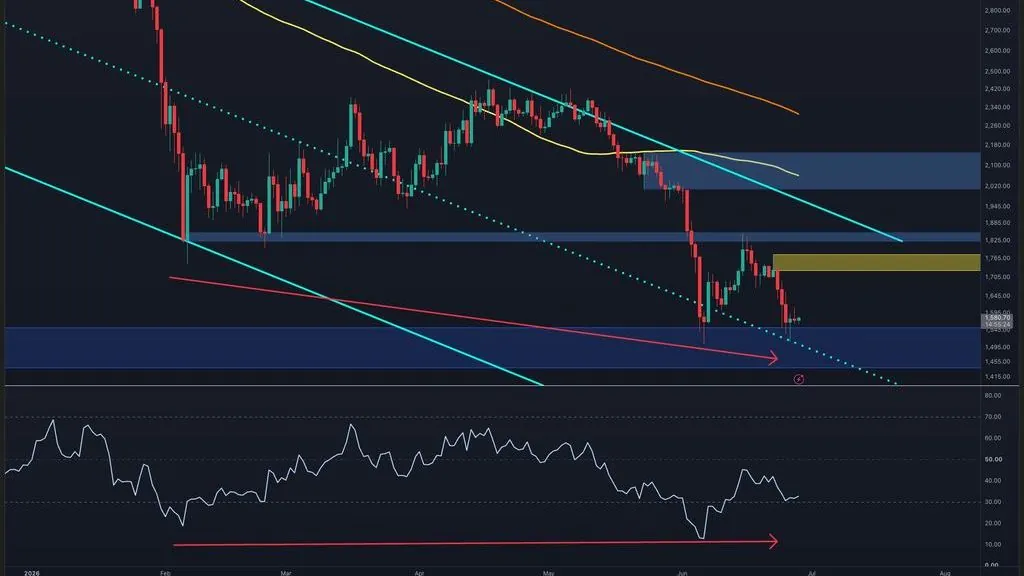
- 1## Daily Chart Shows Divergence Signals Ethereum is exhibiting a daily RSI divergence pattern that suggests sellers may be approaching exhaustion after sustained downside pressure over recent weeks.
- 2While the price remains rejected from higher levels, the technical setup indicates that the intensity of bearish momentum is declining relative to the magnitude of price declines, a classic precursor to potential consolidation or reversal.
- 3## Broader Downtrend Remains in Place Despite the emerging divergence signals, Ethereum's primary trend across higher timeframes remains decisively bearish.
- 4The recent price action should be interpreted as a potential slowdown in decline rather than confirmation of a trend reversal.
- 5Traders monitoring the asset should watch whether RSI holds above key support levels on any subsequent price dips, as a breakdown would signal continuation of downside pressure toward new lows.
Daily Chart Shows Divergence Signals
Ethereum is exhibiting a daily RSI divergence pattern that suggests sellers may be approaching exhaustion after sustained downside pressure over recent weeks. While the price remains rejected from higher levels, the technical setup indicates that the intensity of bearish momentum is declining relative to the magnitude of price declines, a classic precursor to potential consolidation or reversal.
Broader Downtrend Remains in Place
Despite the emerging divergence signals, Ethereum's primary trend across higher timeframes remains decisively bearish. The recent price action should be interpreted as a potential slowdown in decline rather than confirmation of a trend reversal. Traders monitoring the asset should watch whether RSI holds above key support levels on any subsequent price dips, as a breakdown would signal continuation of downside pressure toward new lows.
Why It Matters
For Traders
RSI divergence on the daily may signal diminishing downside momentum, warranting attention to potential support levels before adding to short positions.
For Investors
Technical divergence alone does not confirm a reversal; the broader bearish trend remains dominant and should weigh heavily on multi-month conviction.
For Builders
No direct protocol or infrastructure implications from price-action analysis; technical sentiment is secondary to on-chain fundamentals and governance developments.