Ethereum Faces Major Resistance Cluster Near $1,900, Liquidation Data Suggests
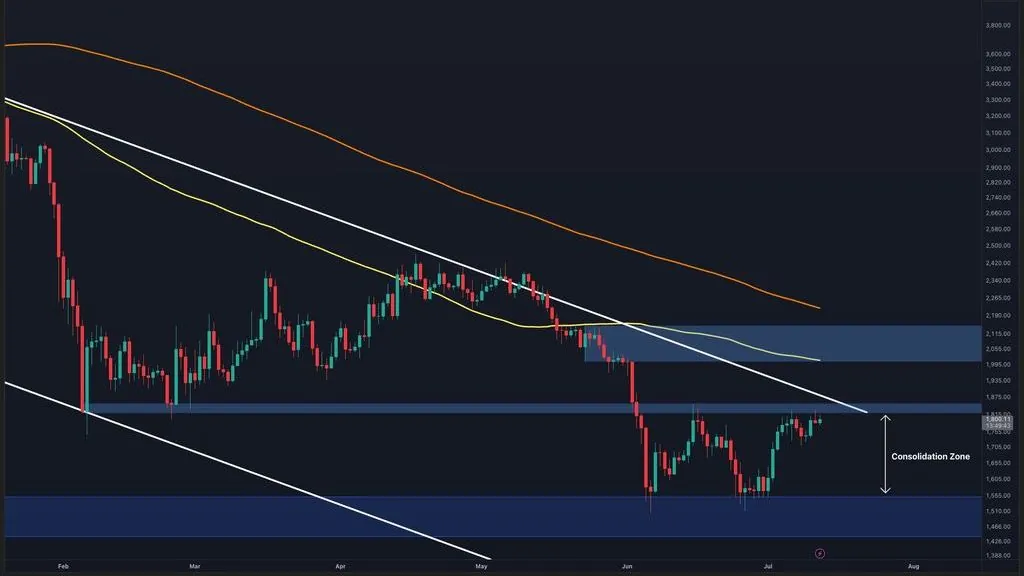
Ethereum has recovered from June lows and approaches a confluence of technical resistance levels around $1,900. On-chain liquidation data aligns with these barriers, suggesting potential volatility if ETH attempts to break higher.
Written by CoinArticle’s AI Newsroom · from 1 cited source. How we work
Technical Resistance Emerges
Ethereum has recovered substantially from its June lows and is now approaching a major confluence of long-term resistance levels near $1,900. The asset faces multiple overlapping resistance points at this price zone, according to technical analysis of historical price action and order book data. Breaking above this cluster would be required for ETH to sustain a rally toward $2,000.
Liquidation Alignment With Price Barriers
On-chain liquidation data shows significant clustering at price levels that correspond closely with these technical resistance points. Large derivative positions are concentrated in this zone, meaning that a move above current resistance could trigger cascading liquidations of short positions, potentially accelerating upside momentum. Conversely, rejection at these levels could cascade liquidations to the downside.
Current Market Position
Ethereum's recent rally has improved short-term sentiment, though the asset remains beneath the long-term resistance confluence. The alignment between technical barriers and liquidation heat maps suggests the $1,900 zone will act as a critical test for continuation toward $2,000 or a potential pullback.
Why It Matters
For Traders
Watch for liquidation cascades around $1,900; breaks above this level could accelerate quickly due to stacked short liquidations.
For Investors
A sustained move through $1,900 would signal strengthening medium-term momentum after the June decline, though confirmation from on-chain volume is important.
For Builders
No direct implications for protocol development; this is a spot price and derivatives market story.
This article is for information only and is not financial advice. Read the full disclaimer.