Ethereum Retraces to $2,000 Support as Smart Money Patterns Draw Historical Comparisons
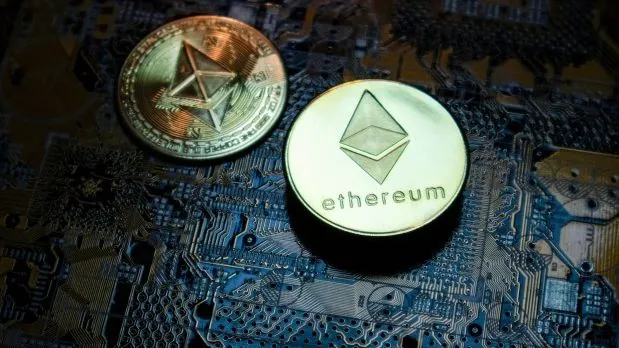
Ethereum fell back to support near $2,000 early Saturday after reversing most of its April gains over the past month. Analysts point to historical smart money patterns that preceded a 173% rally in prior cycles.
Written by CoinArticle’s AI Newsroom · from 1 cited source. How we work
Recent Price Action
Ethereum reversed nearly all of its April gains over the past month and fell to support just above $2,000 in early Saturday trading. The decline erased a period of "fairly good performance" earlier in the month but held at a key technical floor that has offered stability in prior cycles.
Historical Precedent
On-chain analysts have noted that current price action and smart money positioning bear resemblance to a prior pattern that preceded a 173% rally in Ethereum. The pattern suggests institutions and large holders are accumulating at depressed levels rather than distributing during the weakness. Similar support holds have historically marked inflection points where retail capitulation transitions to institutional accumulation phases.
Technical Context
The $2,000 level represents a meaningful floor for Ethereum and has functioned as support during previous market stress periods. Whether Ethereum sustains above this level or breaks lower in the coming sessions will likely determine near-term momentum and test the validity of the historical pattern comparison.
Why It Matters
For Traders
The $2,000 support level is a key technical pivot; a break below could accelerate selling, while a hold may attract tactical buyers positioned on the pattern analogy.
For Investors
Smart money accumulation at support zones has historically preceded multi-month rallies; this pattern if it holds could signal reduced downside risk over a longer horizon.
For Builders
No direct protocol or infrastructure implications from price action and support levels alone; this is purely a market sentiment signal.
This article is for information only and is not financial advice. Read the full disclaimer.