Ethereum TD Sequential Sell Signal Emerges on Weekly Chart
Ethereum has triggered a Tom DeMark Sequential sell signal on its weekly chart, an indicator that last preceded a 63% decline. The setup, which counts nine consecutive green candles, suggests potential trend exhaustion for ETH.
Key Takeaways
- 1## The Signal and Its History Analyst Ali Martinez flagged a Tom DeMark Sequential setup on Ethereum's weekly timeframe, where nine consecutive green candles have completed.
- 2The TD Sequential is a technical analysis tool designed to identify trend exhaustion; once the setup phase reaches nine candles of the same color, it signals potential reversal.
- 3Martinez noted the indicator has been reliable for ETH over the past year, with every weekly signal validated by "significant price action.
- 4" ## Past Performance In April and June of last year, the TD Sequential flashed buy signals that preceded price gains of 86% and 134%, respectively.
- 5The analyst did not specify the timeframe or magnitude of the most recent comparable sell signal, but cited a prior 63% decline tied to the indicator as context for current concern.
The Signal and Its History
Analyst Ali Martinez flagged a Tom DeMark Sequential setup on Ethereum's weekly timeframe, where nine consecutive green candles have completed. The TD Sequential is a technical analysis tool designed to identify trend exhaustion; once the setup phase reaches nine candles of the same color, it signals potential reversal. Martinez noted the indicator has been reliable for ETH over the past year, with every weekly signal validated by "significant price action."
Past Performance
In April and June of last year, the TD Sequential flashed buy signals that preceded price gains of 86% and 134%, respectively. The analyst did not specify the timeframe or magnitude of the most recent comparable sell signal, but cited a prior 63% decline tied to the indicator as context for current concern.
Current Context
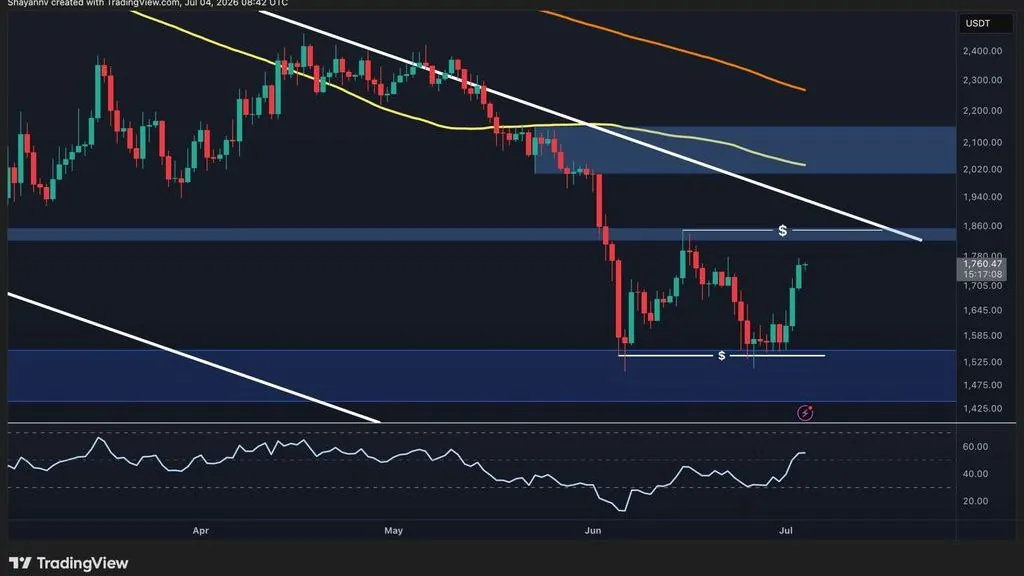
Ethereum has recently declined to $2,250 as trader profit-taking reached a three-week high, according to reporting on the signal. The TD Sequential's setup phase is distinct from its countdown phase; the setup alone signals exhaustion but does not guarantee immediate price movement.
Why It Matters
For Traders
A weekly TD Sequential setup suggests potential trend reversal, but the indicator lacks predictive precision; traders holding ETH should monitor support levels and volume for confirmation.
For Investors
Technical signals alone do not determine long-term value; this chart pattern is a short-term momentum indicator and should not override fundamental conviction in Ethereum's ecosystem or network metrics.
For Builders
No direct implication for protocol development; technical trading signals do not affect Ethereum's underlying security, throughput, or roadmap execution.