Solana Price Breakout: Technical Analysis & Trading Setup
Solana (SOL) is displaying a classic Bollinger Bands squeeze between $77-$94, signaling an imminent price breakout. Technical analysts recommend waiting for confirmed movement outside this range before entering positions.
Key Takeaways
- 1**Bullish scenario**: Break above $94 could ignite upward momentum
- 2**Bearish scenario**: Drop below $77 could accelerate selling pressure
- 3# Solana Price Ready For A Big Move — Is It Time To Jump In?
- 4Solana (SOL) is flashing technical signals that suggest a significant price movement could be imminent.
- 5After trading in a narrow band between $85 and $90 over the past week, the cryptocurrency has caught the attention of technical analysts monitoring key volatility indicators.
Solana Price Ready For A Big Move — Is It Time To Jump In?
Solana (SOL) is flashing technical signals that suggest a significant price movement could be imminent. After trading in a narrow band between $85 and $90 over the past week, the cryptocurrency has caught the attention of technical analysts monitoring key volatility indicators.
Bollinger Bands Squeeze: The Technical Setup
According to CoinGecko data, SOL currently trades at $86.26, up a modest 0.2% in the last 24 hours but down nearly 3% over the past seven days. The critical development lies in the underlying technical setup.
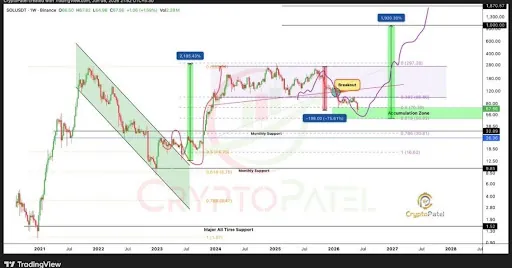
On Solana's 3-day chart, Bollinger Bands are experiencing a notable compression, squeezing between $77 and $94. This tight range indicates exceptionally low volatility—a condition that typically precedes significant price action in cryptocurrency markets.
Prominent crypto analyst Ali Martinez highlighted this setup, comparing the Bollinger Band squeeze to a "coiled spring." According to Martinez's analysis, this compressed state suggests that once volatility returns, SOL could experience a sharp breakout in either direction.
Key Price Levels & Breakout Signals
The $77-$94 range is being characterized as a "no-trade zone" by technical analysts. This means traders are advised to exercise patience rather than opening positions within the squeeze. Conventional technical analysis suggests waiting for a clean candle close outside the Bollinger Bands before committing capital.
Such a break would signal the direction of the eventual move:
- Bullish scenario: Break above $94 could ignite upward momentum
- Bearish scenario: Drop below $77 could accelerate selling pressure
Either outcome could develop into a substantial move given how compressed the bands have become.
Why This Matters For Different Market Participants
For Crypto Traders
The Bollinger Band squeeze presents both an opportunity and a risk. While the potential for significant price movement is attractive, entering during the squeeze could result in getting caught on the wrong side of a volatile swing. Disciplined traders will likely wait for clear confirmation before risking capital.
For SOL Investors
Long-term Solana holders should view this period as a critical technical juncture. A breakout above $94 could reinvigorate bullish momentum for the asset, while a drop below $77 would signal stronger selling pressure. Proper position management and stop-loss placement become increasingly important during low-volatility consolidation.
For Ecosystem Builders
The Solana ecosystem continues advancing regardless of short-term price action. However, periods of low volatility often precede market-moving events, making this a noteworthy time for ecosystem participants monitoring overall cryptocurrency market sentiment.
Trading Strategy Recommendations
Solana's current technical setup suggests traders and investors shouldn't rush into positions prematurely. The most prudent approach involves:
- Waiting for confirmation outside the $77-$94 range
- Monitoring volume on any breakout attempts
- Setting clear entry points based on resistance/support breaks
- Managing risk with appropriate stop-losses
Once volatility returns and the direction becomes clear through established technical patterns, traders can execute strategies with greater confidence.
Final Thoughts
Solana's Bollinger Bands squeeze represents a textbook setup for increased volatility. Whether SOL breaks higher or lower, patience and technical confirmation will likely be rewarded over reactionary trading decisions.
Why It Matters
For Traders
The Bollinger Band squeeze signals imminent volatility, but waiting for breakout confirmation reduces risk of whipsaws.
For Investors
A breakout above $94 could drive bullish momentum, while breaks below $77 indicate potential weakness requiring position adjustments.
For Builders
Low-volatility periods often precede major market moves, making this an important time to monitor ecosystem sentiment and adoption trends.