Bitcoin Consolidates Near $82K as Traders Debate $84K Resistance
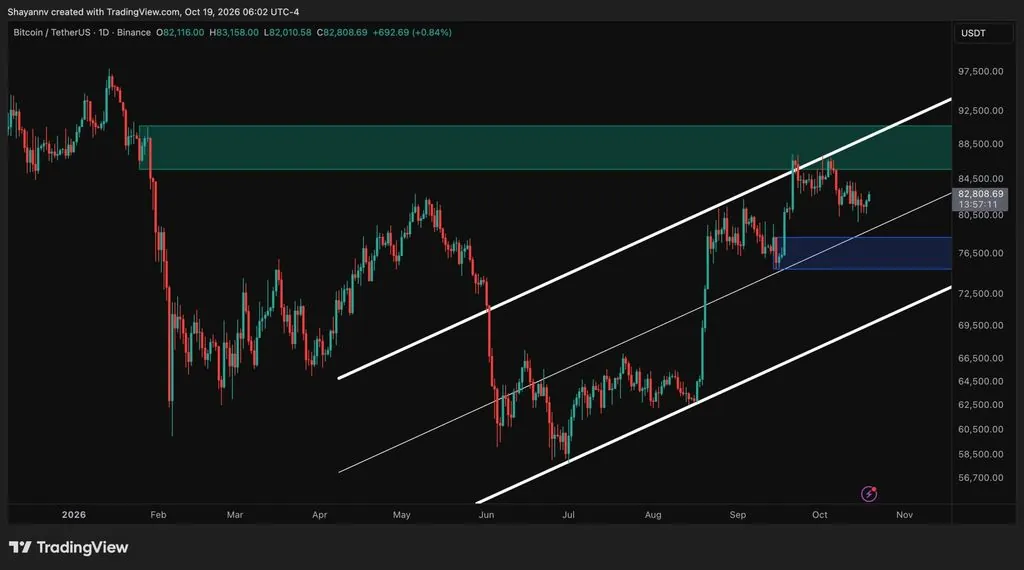
Bitcoin recovered to around $81,700–$82,800 after dipping below $80,000 this week, but remains stuck below key resistance levels. Analysts are split on whether the rebound can clear $84,000 or if weakness will pull the asset toward $77,000 support.
Written by CoinArticle’s AI Newsroom · from 2 cited sources. How we work
Current Price Action and Range-Bound Trading
Bitcoin recovered from a weekly dip below $80,000 to trade in the $81,700–$82,800 range as of Tuesday morning UTC, according to TradingView and on-chain data. The asset has successfully defended the $80,000 demand zone multiple times in recent sessions, but remains trapped between support and the $88,000 resistance that rejected its recent advance.
Analyst Disagreement on the Next Move
Traders are split over the path forward. Some analysts see potential for a push toward $84,000, while others warn that failure to clear that level could trigger a deeper correction toward $77,000. The Bollinger Bands midpoint has become a key technical reference, with a daily close beneath it signaling caution to near-term traders. One measure of this uncertainty: price action remains wedged between the $88,000 resistance ceiling and the broader $77,000–$80,000 support zone that has held over the past week.
Technicals and Adjusted SOPR Signal Mixed Sentiment
On-chain metrics including the Adjusted SOPR (Spent Output Profit Ratio) are showing mixed signals about whether holders are capitulating or accumulating at current levels. The lack of a decisive breakout above $84,000 or below $80,000 reflects hesitation among both bulls and bears, leaving the direction of the next 10–20% move genuinely uncertain.
Why It Matters
For Traders
A close below the $80K support zone could trigger stop-loss cascades toward $77K; a break above $84K resistance would open the $88K–$90K range to long positions.
For Investors
Multi-month holders should focus on whether Bitcoin holds the $77K–$80K support band; extended consolidation here may signal accumulation before a larger move.
For Builders
Sustained price volatility in this range does not materially alter staking economics or L2 deployment decisions; only a break below $70K or above $100K would signal meaningful regime shift.
This article is for information only and is not financial advice. Read the full disclaimer.