Bitcoin's Rare Signal: What Historical Pattern Suggests About Next Rally
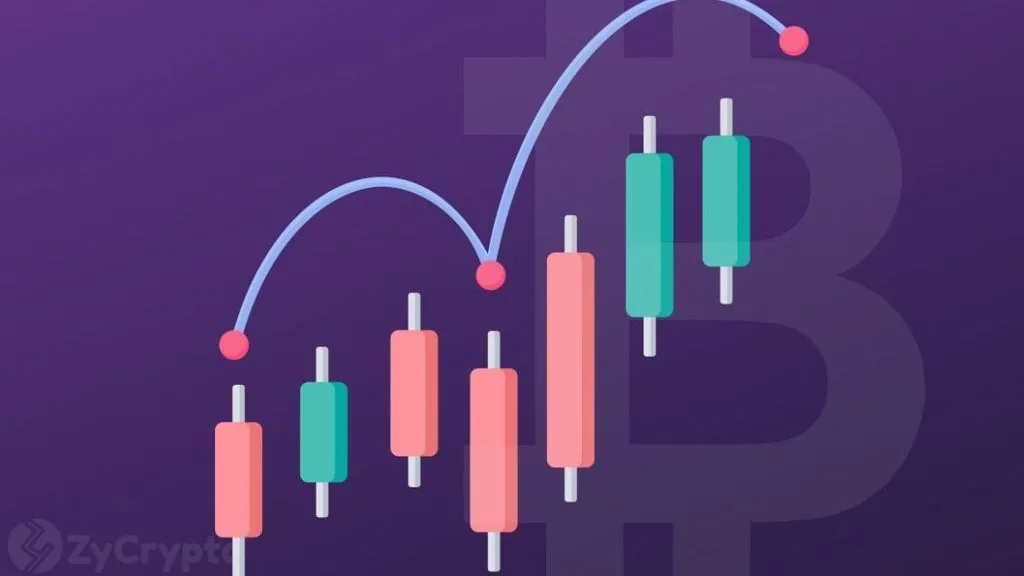
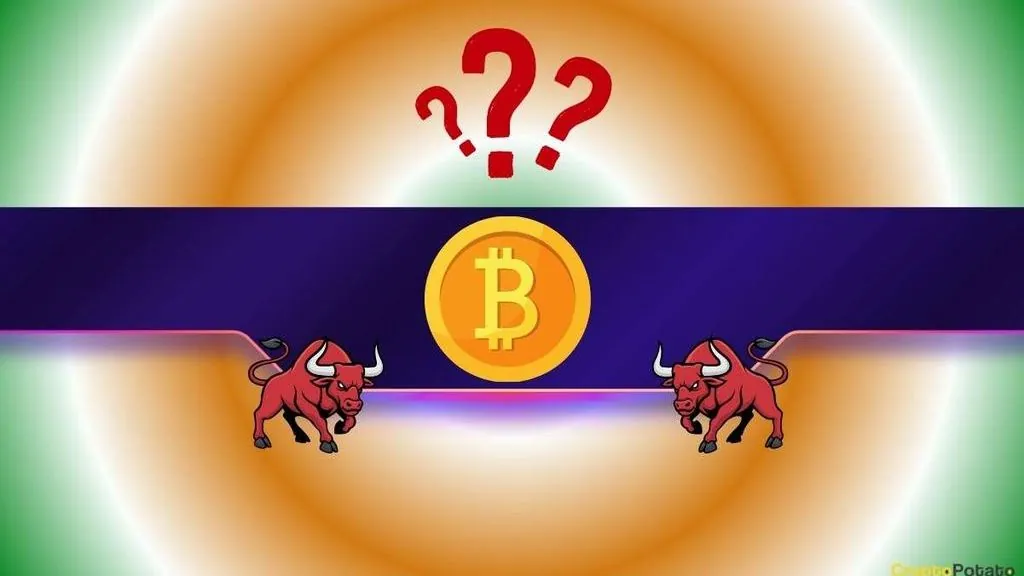
A technical pattern that preceded Bitcoin's 700% rally in the past has appeared again, according to analysts studying historical price charts. If the pattern repeats, BTC could potentially exceed $500,000, though past performance does not guarantee future results.
Written by CoinArticle’s AI Newsroom · from 1 cited source. How we work
The Historical Pattern
Analysts have identified a technical formation in Bitcoin's price action that last appeared before a sustained 700% advance. The specific pattern, which is considered rare in BTC's multi-year chart history, emerged across multiple timeframes and has been cited by several on-chain research firms as a potential precursor to significant upside moves.
Implications of Repetition
If Bitcoin were to replicate the proportional gains from the previous occurrence of this pattern, the asset would need to rally above $500,000 from current levels. However, technical patterns carry no guarantee of repetition, and market conditions—including macro headwinds, regulatory developments, and shifts in institutional participation—differ materially from prior cycles.
Pattern Recognition Limitations
Historical technical signals offer a framework for analysis but remain probabilistic rather than predictive. Bitcoin's price action is shaped by on-chain transaction patterns, derivatives flows, macroeconomic sentiment, and regulatory announcements—variables that do not move in lockstep with chart formations alone.
Why It Matters
For Traders
Chart patterns can inform position sizing and risk management decisions, but should not be used as standalone entry or exit signals without corroborating on-chain or macro data.
For Investors
Technical analysis serves as one input among many; conviction on long-term Bitcoin allocation should rest on utility, adoption, and regulatory clarity rather than pattern repetition.
For Builders
Bitcoin's price action is a lagging indicator of network health; focus on transaction volume, validator participation, and protocol security rather than price forecasts.
This article is for information only and is not financial advice. Read the full disclaimer.