Cardano Consolidates as Traders Watch for Next Price Pattern
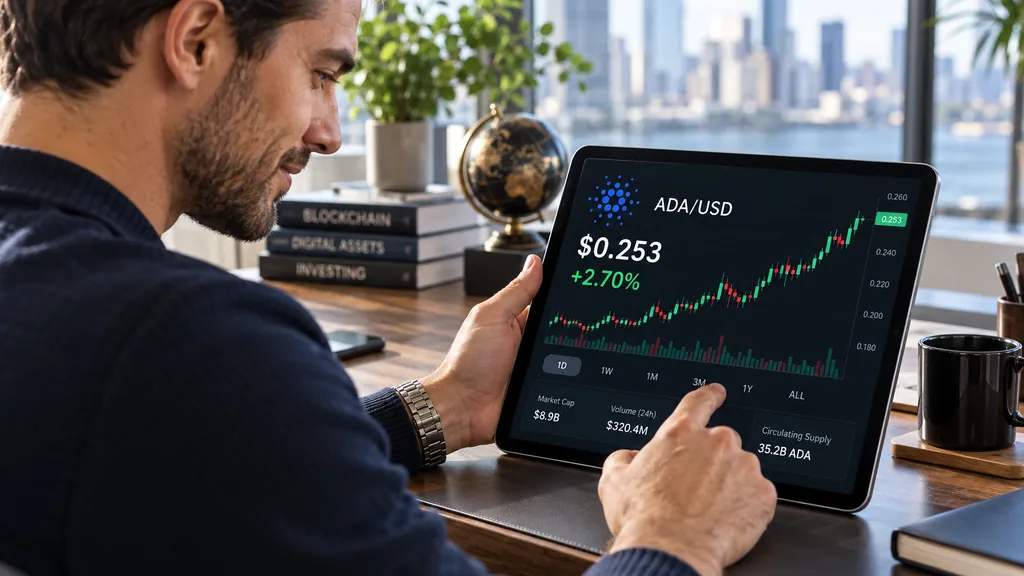
Cardano has entered a consolidation phase, with ADA trading in a narrow range and attracting renewed attention to technical patterns. The period of sideways movement comes as traders reassess support and resistance levels after recent volatility.
Written by CoinArticle’s AI Newsroom · from 1 cited source. How we work
Current Consolidation Zone
Cardano has settled into a consolidation band, with ADA trading between defined support and resistance levels. Traders are closely monitoring intraday ranges and looking for signs of either a breakout above resistance or a breakdown through support. Volume has compressed relative to prior weeks, a typical marker of consolidation periods.
Pattern Recognition and Breakout Scenarios
The consolidation has put technical analysis patterns back in focus. Traders are watching for chart formations—triangles, rectangles, or flags—that historically precede directional moves. A sustained break above resistance would likely trigger fresh buying interest, while a drop below support could signal renewed selling pressure.
Broader Context for ADA
Cardano remains embedded in crypto's macro conversation around risk sentiment and regulatory clarity. The consolidation phase offers traders time to reassess their theses before the next directional test, whether driven by technical setup, protocol developments, or broader market shifts.
Why It Matters
For Traders
Consolidation often precedes a directional breakout; watch for volume spike and close above or below the range to signal the next move.
For Investors
A sustained break in either direction may clarify near-term trend, informing rebalancing decisions for multi-month positions.
For Builders
Network activity and on-chain metrics during consolidation can reveal whether developer or user engagement is shifting independent of price.
This article is for information only and is not financial advice. Read the full disclaimer.