XRP Rebounds Above $1 as Brandt Signals Bitcoin Preference
XRP recovered above $1 after briefly dipping below that level, but prominent trader Peter Brandt stated he would convert a 500,000 XRP position into Bitcoin. Technical indicators remain weak despite the rebound, with the token trading below its major moving averages.
Written by CoinArticle’s AI Newsroom · from 2 cited sources. How we work
Story Updates
- Updated Aug 16, 2026, 11:03 AM: Peter Brandt states he would convert XRP holdings to Bitcoin, signaling reduced conviction in the token.
Price Action and the $1 Test
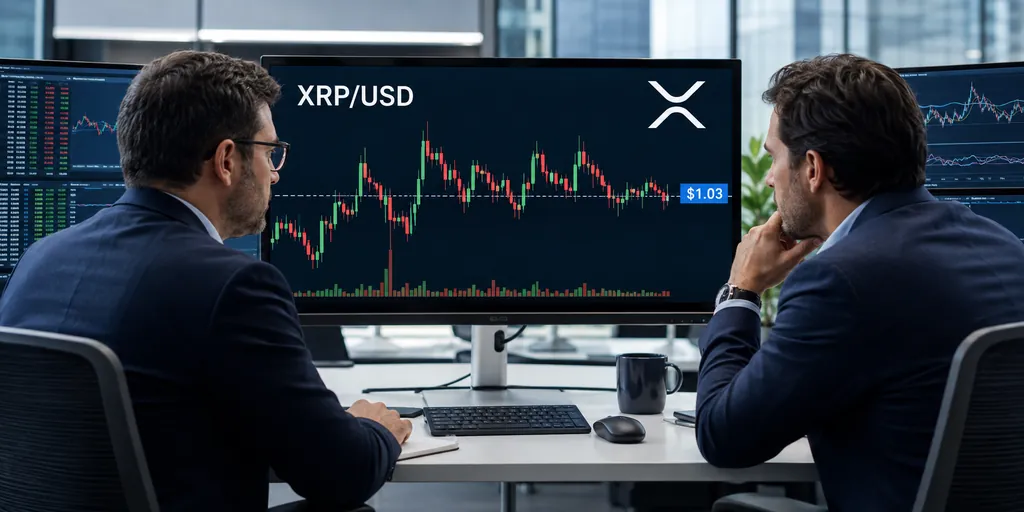
XRP traded above $1.03 on Monday after briefly falling below $1 support earlier in the session, marking a modest rebound from last week's 5% decline. Despite the recovery, the token remains below its 50-day, 100-day, and 200-day exponential moving averages, according to CoinJournal's analysis. This positioning—trading below multiple key moving averages—is a standard indicator of downtrend structure in technical analysis.
Prominent Trader Signals Bitcoin Preference
Peter Brandt, a veteran chartist followed by traders across crypto markets, said on social media that he would convert a hypothetical 500,000 XRP position directly into Bitcoin rather than hold the token. Brandt did not detail the reasoning behind the preference, but the statement was published as XRP approached its $1 support level. Such public positioning by a recognized trader can influence market psychology, though it does not represent a binding trade.
Momentum Remains Bearish
The Relative Strength Index (RSI) reading near 39 indicates the token has not yet reached oversold territory, which typically begins at 30. A negative MACD signal reinforces the bearish technical picture. Together, these momentum indicators suggest that selling pressure persists despite Monday's rebound, leaving the $1 support level at risk of a breakdown if broader selling resumes.
Why It Matters
For Traders
A break below $1 could accelerate selling; Brandt's public positioning may influence short-term sentiment and trigger stop-losses.
For Investors
Skepticism from recognized technicians reflects broader medium-term weakness; sustained underperformance without a catalyst suggests continued downward pressure.
For Builders
Negative sentiment from influential traders does not affect protocol development directly but may dampen ecosystem funding and adoption momentum.
This article is for information only and is not financial advice. Read the full disclaimer.