Ethereum Holds Near $2,300 as Technical Bears Eye $2,000 Support
Ether is trading near $2,250 to $2,300 after a recovery failed to reverse its broader downtrend, according to CryptoPotato's technical analysis. Analysts are watching the $2,170 to $2,220 support zone and the psychological $2,000 level, while sources differ on how bullish the near-term setup looks.
Written by CoinArticle’s AI Newsroom · from 2 cited sources. How we work
Price Structure and Key Levels
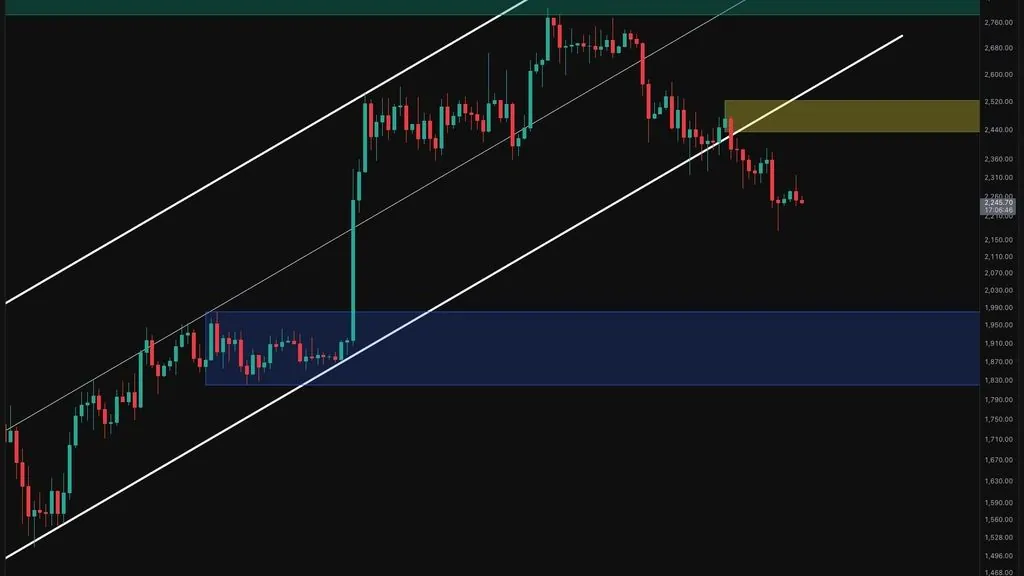
Ethereum is trading in the $2,250 to $2,300 range after a recent bounce failed to reverse the broader downtrend, according to CryptoPotato's daily chart analysis. The asset broke below an ascending daily channel, rebounded into a $2,440 to $2,520 supply zone, and was rejected there, leaving a sequence of lower highs and lower lows.
The most recent selloff produced a sharp wick to about $2,170 before a modest recovery that has struggled to hold above $2,260. CryptoPotato identifies the $2,170 to $2,220 area as near-term support, with a sustained break below it exposing the psychological $2,000 level and a broader daily demand zone between roughly $1,820 and $1,980.
Short-Term Outlook on the Four-Hour Chart
On the four-hour timeframe, ETH continues to trade inside a descending channel. A bounce from the lower channel boundary reached about $2,310 but was rejected, returning price near $2,250. CryptoPotato says sellers still control the short-term structure, and a retest of the $2,170 to $2,220 zone is plausible if ETH cannot reclaim $2,300 to $2,310.
A sustained move above $2,310 would bring the channel's upper boundary, near $2,350 to $2,380, into focus. Clearing that trendline would weaken the immediate bearish setup and could open a path toward the $2,440 to $2,520 supply zone.
Derivatives Positioning and Liquidation Risk
CryptoPotato cites a Binance ETH/USDT liquidation heatmap showing estimated long liquidation clusters near $2,150 to $2,200, overlapping the chart support zone, and a larger concentration around $2,000 to $2,050. The outlet notes that a move into those levels could trigger long liquidations and amplify downside volatility, while stressing that the heatmap shows potential exposure rather than confirmed price targets or buying support.
Where the Sources Diverge
Bitcoinist frames the picture differently. Its coverage describes Ether as hovering below $2,000, a level that CryptoPotato's analysis places below current trading. Bitcoinist also argues that ETH is mirroring a historical pattern that points to an impending rebound, a view that CryptoPotato does not share; its analysis treats the current structure as bearish until the $2,440 to $2,520 zone is reclaimed. The two sources also describe the price level differently, so readers should check current quotes on a live data provider before relying on either reference point.
The Bitcoinist piece is a broader market-behavior report, while CryptoPotato's is a levels-based technical read with explicit invalidation points. Neither source reports on-chain flows or filings that would independently confirm a directional call.
Why It Matters
For Traders
The $2,170 to $2,220 support zone and the $2,000 psychological level are the reference points technical analysts are watching over the next few sessions.
For Investors
Ether remains below its prior supply zones, so a multi-month recovery case depends on reclaiming levels that the current downtrend has repeatedly rejected.
For Builders
Liquidation clustering near $2,000 to $2,200 on major venues may increase volatility for applications that depend on ETH collateral or lending thresholds.
This article is for information only and is not financial advice. Read the full disclaimer.