XRP Holds Near $1.25 as ETF Inflows Slow and Technicals Stay Bearish
XRP traded around $1.25 in early November after falling roughly 15% over the past month, while U.S. spot XRP ETFs recorded $18.83 million in October net inflows. Sources differ on the severity of the chart setup, and both point to the $1.20 to $1.23 zone as the level to watch.
Written by CoinArticle’s AI Newsroom · from 2 cited sources. How we work
Price Holds Near $1.25 as Support Is Tested
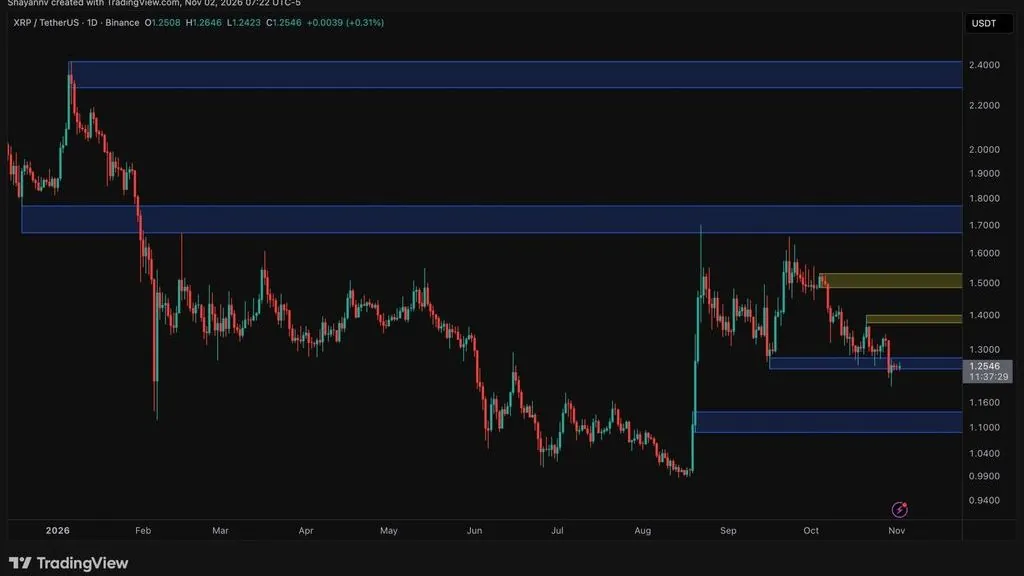
XRP traded between $1.24 and $1.26 on November 2, according to crypto.news price data, and has lost roughly 15% over the past month. CryptoPotato reported the token briefly slipped to approximately $1.20 in the prior week before buyers re-entered the $1.25 zone, which both outlets treat as the immediate battleground.
The two sources frame the technical picture differently. Crypto.news cites Bollinger Bands placing the 20-day moving average at $1.2999 and the lower band at $1.2323, with the MACD still negative at -0.0372 against a signal line of -0.0340. CryptoPotato describes a descending channel on the 4-hour chart, with a recent lower high near $1.34 and the upper trendline currently around $1.28. Both readings point to sellers still holding the advantage, though CryptoPotato describes the recent recovery from $1.20 as evidence that buyers are absorbing selling pressure.
ETF Demand Continues, but at a Slower Pace
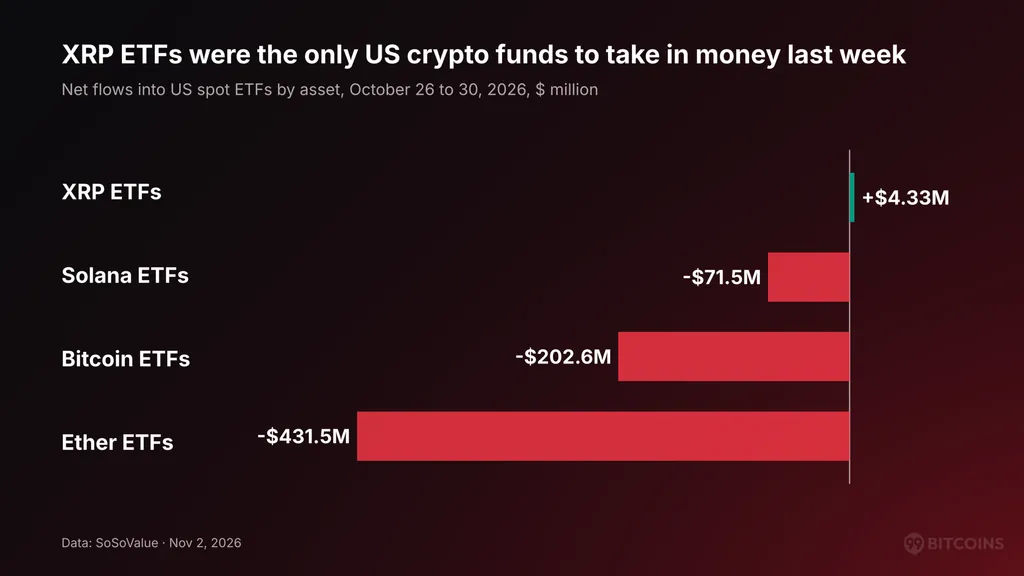
U.S. spot XRP ETFs ended October with $18.83 million in net inflows, according to SoSoValue data cited by crypto.news. Cumulative net inflows reached $1.81 billion, and October marked the seventh consecutive month of positive net subscriptions. Bitwise led the products with approximately $682 million in cumulative inflows, followed by Franklin Templeton's XRPZ at $524 million and Canary Capital's XRPC at $485 million.
The October figure was the second-lowest monthly inflow recorded for the products, exceeding only January's $15.59 million. Weekly outflows of $1.84 million in mid-October ended a 13-week streak of positive subscriptions before inflows resumed. Crypto.news notes that the fund flows did not translate into a sustained price recovery.
Key Levels and Long-Term Views
Crypto.news identifies a move below the $1.2323 lower Bollinger Band as a threat to the recent support area, while a recovery above $1.2999 would bring the middle band back into focus. CryptoPotato frames the decisive level as $1.20, where a loss would point toward the channel's lower boundary near $1.15 and the $1.10 demand zone beneath it. Above current prices, both sources identify the $1.40 area, where the October rebound was rejected, as the first meaningful resistance.
Longer-horizon commentary is more speculative. Analyst Carolina, cited by crypto.news, pointed to a monthly relative strength index approaching levels associated with past turning points and listed $1.50, $3.50, $7.00 and $14.00 as potential long-term targets. The crypto.news report notes these projections are speculative and that an oversold RSI does not establish a bottom. Separately, EGRAG Crypto described October 2026's 16% decline as the fourth-worst October since 2013, and noted that seven of the 13 completed Novembers between 2013 and 2025 closed negative, against six positive. Trading volume on the supplied daily chart was 23.64 million XRP.
Why It Matters
For Traders
The $1.20 to $1.23 zone is the level both sources flag as decisive, so a daily close below it would likely be the signal that support has failed.
For Investors
ETF inflows have continued for seven straight months but are shrinking, which suggests steady institutional interest that has not yet produced price momentum.
For Builders
Products and tooling tied to XRP price feeds and ETF flow data should account for weaker October subscriptions when modeling demand scenarios.
This article is for information only and is not financial advice. Read the full disclaimer.