XRP Slips Below $1.30 as Derivatives Turn Bearish and Chart Structure Weakens
XRP traded below $1.30 on Thursday, with CoinJournal citing a long-to-short ratio of 0.82 as evidence of bearish derivatives positioning. CryptoPotato's technical read places the token near a $1.25 Fibonacci support zone, where sources disagree on how far the price has already fallen.
Written by CoinArticle’s AI Newsroom · from 2 cited sources. How we work
Price Action and Derivatives Positioning
XRP dropped below $1.30 on Thursday, according to CoinJournal, which attributed the move to bearish derivatives positioning. The outlet cited a long-to-short ratio of 0.82 in the tracked data, a reading below 1 that indicates more traders holding short positions than long ones. CoinJournal also tied the decline to the Federal Reserve's cautious decision to hold rates, which it said weighed on risk appetite.
Technical Levels Under Watch
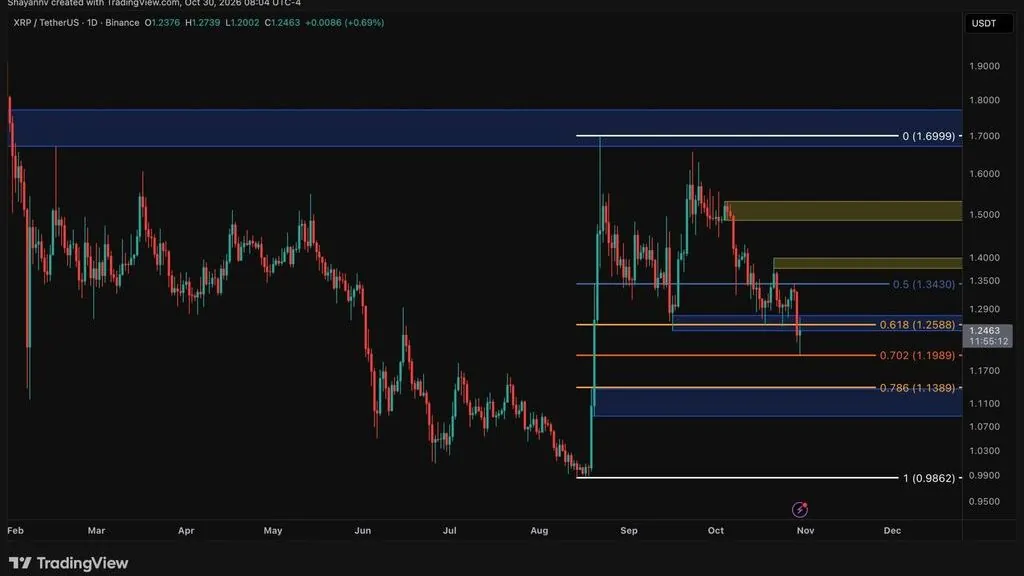
CryptoPotato's daily chart analysis places XRP in a retracement of its August rally, which carried the token from a $0.99 low to a $1.70 high. The token has since printed lower highs and lower lows and lost the 0.5 Fibonacci retracement at $1.34 earlier in the month. The outlet identifies the $1.25 area as the key support, where the 0.618 retracement coincides with a demand zone from mid-September.
The sources differ on how far the token has already moved into that support. CoinJournal frames the price as having dipped below $1.30 and needing to reclaim the $1.333 to $1.372 resistance band. CryptoPotato reports the price trading around $1.25 and says a wick briefly reached roughly $1.20 before buyers pushed it back up, a level it describes as the last line before a deeper test at $1.10 to $1.14. Both outlets agree that a recovery above the $1.34 to $1.40 zone is needed to change the near-term structure.
Outlook and What Would Change It
CryptoPotato's four-hour analysis shows XRP inside a descending channel since its late-September peak near $1.65, with the upper boundary near $1.30 to $1.33 rejecting recent rallies. Its view is that the short-term pattern still favors sellers, and that a sustained break above the channel and the $1.40 supply zone would be needed to shift the trend. A decisive daily close below $1.20 would, in its framework, expose the $1.17 channel floor and the $1.10 to $1.14 zone.
Neither source provides a timeline or a forecast beyond these technical thresholds, and the derivatives figure reflects a single tracked dataset rather than a market-wide measure.
Why It Matters
For Traders
With XRP near the $1.20 to $1.25 support band, a daily close below $1.20 would be the level technical analysts flag as the trigger for a test of the $1.10 to $1.14 zone.
For Investors
Sustained sub-1 long-to-short readings and lower highs since September suggest the August rebound has not yet established a durable new trend for the asset.
For Builders
Teams with XRP-denominated liquidity or treasury exposure should note that the price has now given back much of the August gain, which affects collateral and valuation assumptions.
This article is for information only and is not financial advice. Read the full disclaimer.