Bitcoin Bottom Signals Diverge: Monthly MACD Pattern Versus Cycle Structure Views
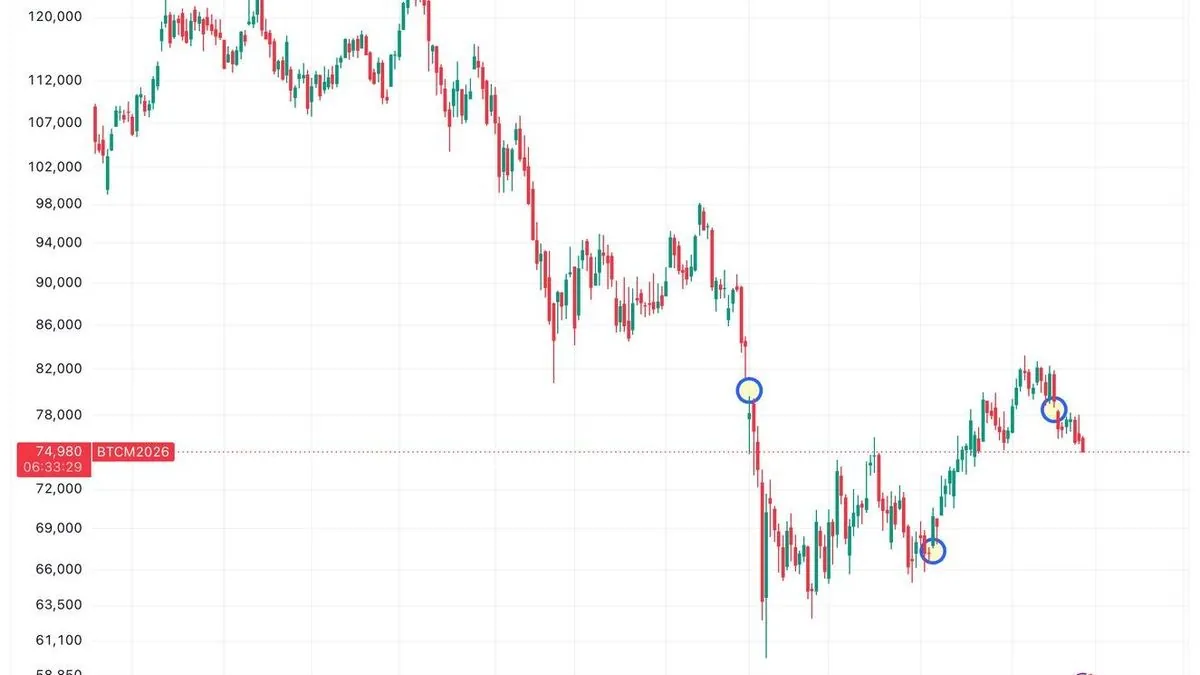
Bitcoin trades near $76,000 as analysts disagree on whether the bear market bottom has formed. A monthly MACD pattern points to a possible low, while a separate trader argues market structure already marks the bottom, and one technical view leaves room for a drop below $50,000.
Written by CoinArticle’s AI Newsroom · from 2 cited sources. How we work
Where the Price Stands
Bitcoin was trading just above $76,000 at the time of the reporting, after briefly reaching near $81,000 on the previous day. Per CryptoPotato, the asset fell more than 5% over 24 hours and is down about 39% from its $126,000 all-time high set in October of last year. The drop followed the liquidation of more than $560 million in positions in under an hour, most of them long bets, as US stocks weakened.
A Monthly Momentum Signal
NewsBTC, citing analyst Washigorira, describes a setup built on the monthly logarithmic MACD histogram. In past cycles, Bitcoin bottoms formed after the darker red histogram bars faded into two consecutive lighter red bars, a pattern the analyst links to lows in 2012, 2015, 2019 and the late 2022 to early 2023 recovery. The histogram turned deep red in September 2025, and April 2026 printed the first lighter bar since then.
The signal is not yet confirmed. May has not closed, and Bitcoin has struggled to reclaim $80,000 this month. A second lighter bar at the May close would complete the pattern, while a weak close that restores a deep red bar would delay it. NewsBTC also notes that spot Bitcoin ETF outflows and weak exchange demand have not necessarily invalidated the histogram reading.
A Different Read on the Bottom
CryptoPotato reports that trader KillaXBT argues the bottom is already in on a structural basis. KillaXBT says Bitcoin has historically formed three significant lows per cycle and that the 2023 low resembled the current year's price action, with two lows forming close together. The trader distinguishes structure from seasonality, noting that Bitcoin cycle lows have often landed in the fourth quarter, and says a new low before year-end would not fit the typical cycle shape.
Where the Two Views Disagree
The two sources reach different conclusions on timing. The MACD analysis treats the bottom as unconfirmed and says the decline could still extend, with some technical analysts warning of a move below $50,000. KillaXBT treats the bottom as already formed and rejects the seasonal argument for another low this year. Neither source is fully confirmed by price, and the disagreement rests on which framework, momentum or structure, carries more weight.
Levels Analysts Are Watching
Ash Crypto, cited by CryptoPotato, named the 50-week moving average near $75,500 as a level Bitcoin needs to hold, and a return above $80,000 as needed to improve momentum. He attributed the broader sell-off to proposed restrictions on advanced AI development and renewed concern about escalation in the Iran conflict. Both levels are the reference points the two bottom theses will likely be tested against in the coming weeks.
Why It Matters
For Traders
Bitcoin's $75,500 to $80,000 range is the level both bottom theses reference, so the May monthly close and a hold or loss of the 50-week average will shape near-term price direction.
For Investors
Two credible but opposing frameworks, one momentum-based and one structure-based, mean the cycle bottom is not yet settled, which argues for weighing the range of outcomes rather than a single timeline.
For Builders
Contradicting cycle calls highlight volatility risk for protocols with Bitcoin-collateralized lending or liquidation logic, which should be stress-tested against a move toward $50,000.
This article is for information only and is not financial advice. Read the full disclaimer.