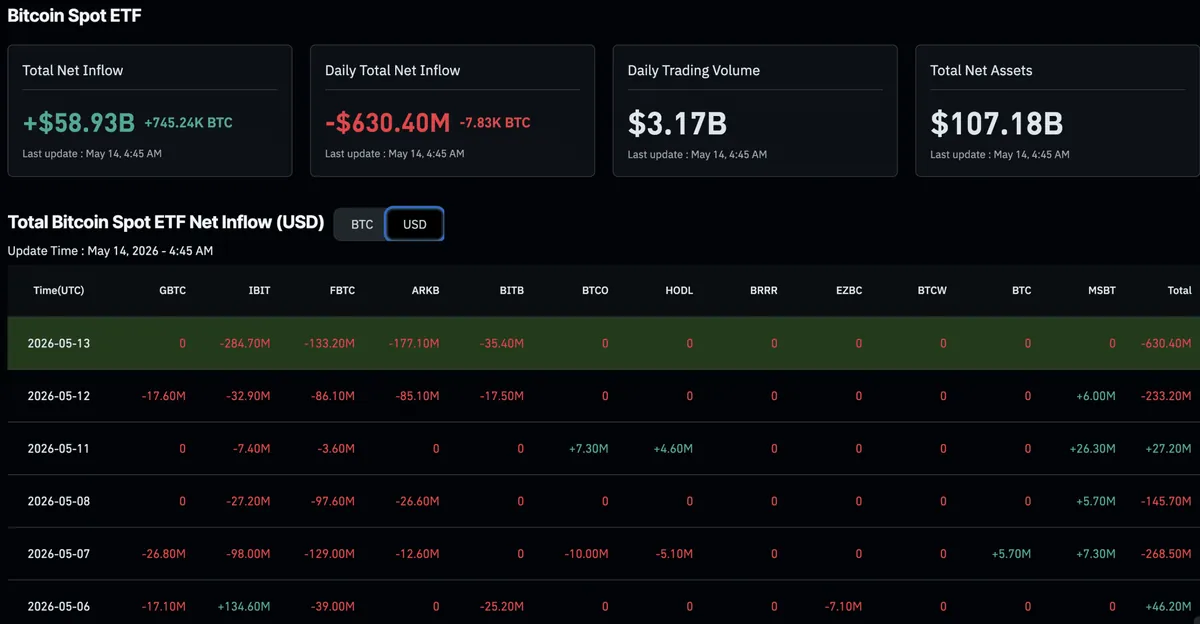
Bitcoin Retests $80K Resistance as Analysts Flag Downside Risk to $75K
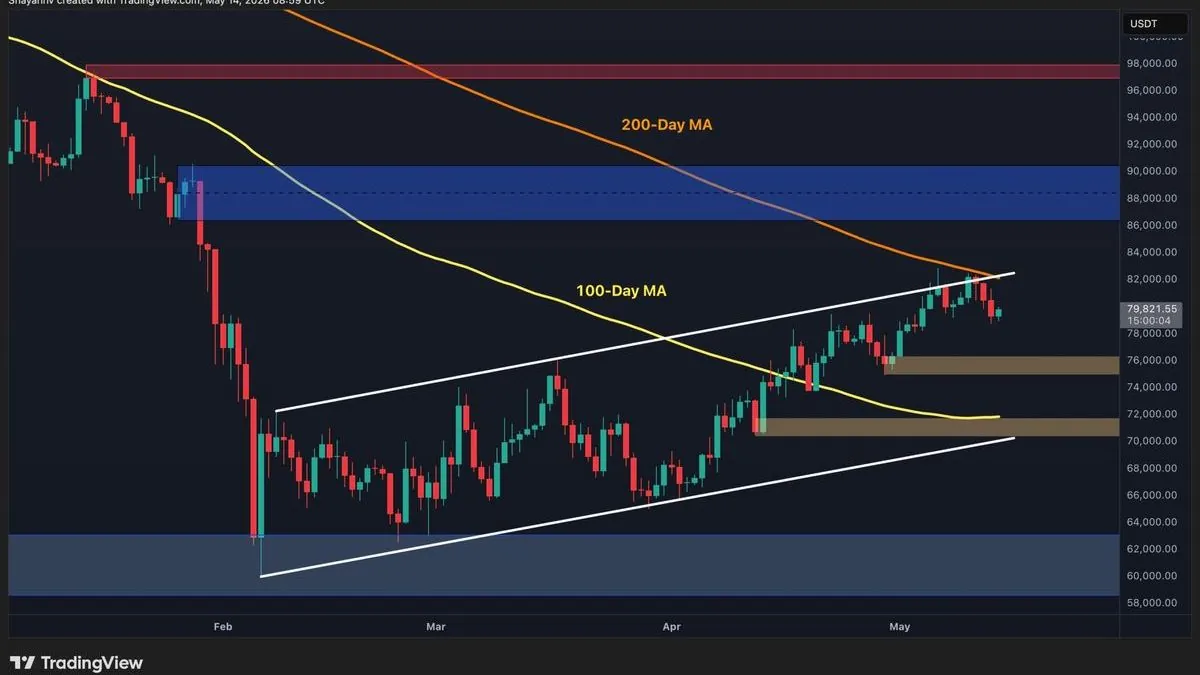
Bitcoin has traded near $78,000 after another rejection at $82,000, according to Bitcoinist. Technical analysts at CryptoPotato identify $80,000 to $82,000 as a supply zone that could push price toward $75,000 and then $70,000 to $71,000.
Written by CoinArticle’s AI Newsroom · from 2 cited sources. How we work
Price Action and the $80K-$82K Supply Zone
Bitcoin is trading around $78,000 after being rejected again at $82,000 on Friday, according to Bitcoinist. Both reports place the current pullback inside a supply area that has capped the recent recovery rally from the $60,000 region.
CryptoPotato describes the $80,000 level as a confluence of supply. It cites the upper boundary of a broader ascending channel and the 200-day moving average near $82,000 as overlapping resistance that sellers have repeatedly defended.
Technical Downside Levels
CryptoPotato's daily and 4-hour analysis identifies $75,000 as the first key demand zone if selling persists. It also notes that the 4-hour chart has broken below an ascending trendline that supported the bounce from $60,000, which it characterizes as an early sign that momentum is fading.
If the decline deepens, CryptoPotato points to $71,000 to $70,000 as a broader accumulation range that buyers previously defended. The same report notes a concentration of liquidations on Binance's BTC/USDT heatmap around $77,000, which it argues could draw price lower.
On-Chain Signals and Profit-Taking
Bitcoinist frames the move through the MVRV ratio, arguing that several analysts see Bitcoin in the early stages of a prolonged correction toward what they term an "actual" price bottom. The report presents this as analyst interpretation rather than a confirmed signal, and it does not state a specific MVRV reading in the excerpt available.
CryptoPotato attributes part of the selling pressure to holders who bought during the capitulation toward $60,000 now taking profits near resistance. The report does not cite a specific on-chain dataset for that claim.
Where the Sources Diverge
The two outlets agree on the price structure: $80,000 to $82,000 is resistance and $75,000 is the next support. They differ on the framing. CryptoPotato is a technical read focused on chart levels and liquidation clusters, while Bitcoinist centers its case on a cycle-bottom thesis drawn from the MVRV pattern. The sources do not conflict on the current price, which both place near $78,000, but the excerpts available do not give the same timeframe for a bottom, and neither provides a verified on-chain figure for holder profit-taking.
The analysis in both pieces is forward-looking and should be read as a set of scenarios tied to whether Bitcoin can reclaim $80,000 to $82,000.
Why It Matters
For Traders
A close below the $77,000 liquidation cluster could accelerate selling toward $75,000, so the $80,000 to $82,000 band is the level to watch in the next 24 to 72 hours.
For Investors
Repeated rejection at the 200-day moving average and a cycle-bottom thesis based on MVRV put the longer-term structure under scrutiny even as the Q2 2026 rally held for five weeks.
For Builders
Liquidation clustering on Binance's BTC/USDT heatmap highlights how concentrated leverage can drive price toward specific levels, a factor for risk engines and oracle-dependent protocols.
This article is for information only and is not financial advice. Read the full disclaimer.