Bitcoin Slides Toward $73,000 as Analysts Split on $65,000 Downside and $76,000 Recovery Targets
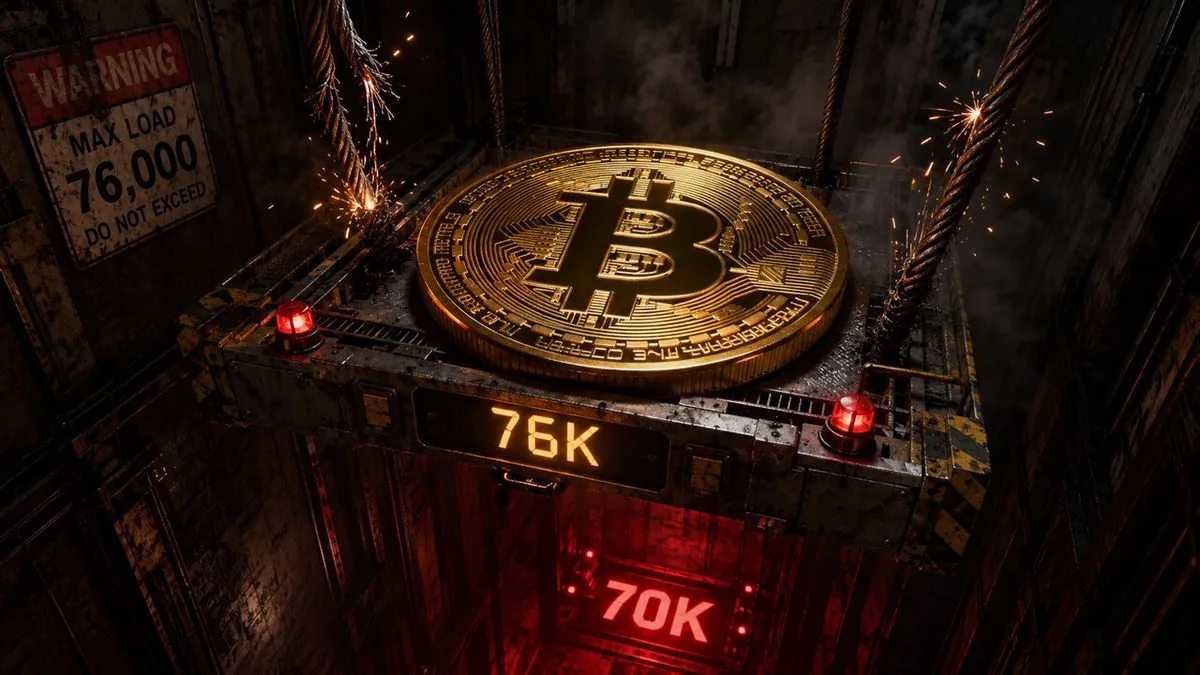
Bitcoin has fallen from near $80,000 into the $73,000 to $74,000 range, with recent macro and ETF data weighing on prices. Analysts disagree on whether the $76,000 to $77,500 zone will act as a rebound target or whether a drop toward $65,000 is more likely.
Written by CoinArticle’s AI Newsroom · from 2 cited sources. How we work
Price Action and Key Levels
Bitcoin traded near $73,500 in the days through Nov. 11, after falling from near $80,000 over the past week, according to CoinGlass's weekly heatmap. Crypto.news reported that the latest candles remain below $75,000, a level buyers had defended earlier in the week.
Coverage from CryptoSlate, published earlier in the cycle, framed the $76,000 area as the immediate support to watch, with Bitcoin having been rejected near $82,000 and $82,200, roughly where its 200-day moving average sits. Wintermute said Bitcoin had been rejected at that moving average five times that month. The two outlets worked from different reference points, so their levels do not map one-to-one onto the current price.
Onchain Cost Basis Signals
Glassnode's Nov. 11 report places Bitcoin below its $75,600 short-term holder cost basis, the average price of coins held for fewer than 155 days. Only around 35% of that supply remains in profit. Glassnode estimates that reclaiming the $77,500 True Market Mean would return roughly half of short-term holder supply to profit, while about two-thirds of those coins currently sit above price, which could create breakeven selling into rallies.
CryptoQuant data cited by CryptoSlate showed a sharp buildup in leverage during April's advance, with BTC perpetual futures open interest growing at the fastest pace so far in 2026. That leverage lifted prices but left the market exposed once conditions turned.
Analyst Disagreement on Downside Risk
Pseudonymous analyst Tranquility Crypto said in a Nov. 11 post that Bitcoin has traded inside a descending channel since September and is slipping below its lower trendline, with an expected move toward $65,000. From $73,500, that target implies a further decline of about 11.6%. The analyst said they wanted Bitcoin to reclaim the broken structure before becoming comfortable calling a bottom.
Glassnode's six-month map points to a different set of levels. It places the largest downside liquidity cluster between $59,500 and $62,600, and says most nearby long-liquidation levels have already been cleared. The two sources therefore disagree on both the likely downside zone and how much leverage remains to be flushed.
Upside Liquidity and Macro Backdrop
Analyst Ted Pillows identified a large short-side liquidity cluster between $76,000 and $77,500 in a Nov. 11 post, arguing price tends to move toward major liquidity zones if equities show stronger momentum. Reaching $76,000 from $73,500 would require a gain of about 3.4%, and $77,500 about 5.4%.
The macro picture has been less supportive. CryptoSlate reported that April's CPI came in at 3.8% year over year against a 3.7% consensus, that the 10-year Treasury yield reached 4.58%, and that futures markets had moved to price a 44% probability of a rate hike by December. Kevin Warsh's confirmation as Fed Chair ahead of the June 16-17 FOMC meeting adds to the hawkish read Wintermute described.
ETF Flows
Crypto.news reported that U.S. spot Bitcoin ETFs recorded net weekly outflows of about $1.28 billion during Nov. 2 to 6, with BlackRock's IBIT accounting for $1.21 billion of that. Farside Investors data showed further outflows of $201 million on Nov. 9 and $95 million on Nov. 10, bringing the Nov. 2 to 10 total to $1.58 billion. Tuesday's outflow was about 52.7% smaller than Monday's. Morgan Stanley's MSBT took in $20 million on Tuesday, partially offsetting outflows from other products.
Why It Matters
For Traders
The $75,600 short-term holder cost basis and the $76,000 to $77,500 liquidity cluster are the nearest levels where selling or short-covering could define the next 24 to 72 hours.
For Investors
Sustained ETF outflows alongside a hawkish rate outlook suggest institutional demand has weakened relative to the spring rally, which matters for multi-month positioning.
For Builders
Sharp leverage buildup and liquidation clusters highlight the value of monitoring perpetuals open interest and funding data in any protocol that depends on BTC collateral prices.
This article is for information only and is not financial advice. Read the full disclaimer.