Bitcoin Slips Toward $76K as Demand Zone and Cost Basis Come Into Focus
Bitcoin fell below $77,000 on Monday after losing the $80,000 support area, with price testing a $75,000-$78,000 daily demand zone. Analysts cite a $76,000-$76,500 realized price for recent holders as the next key reference point.
Written by CoinArticle’s AI Newsroom · from 2 cited sources. How we work
Price Action and Key Levels
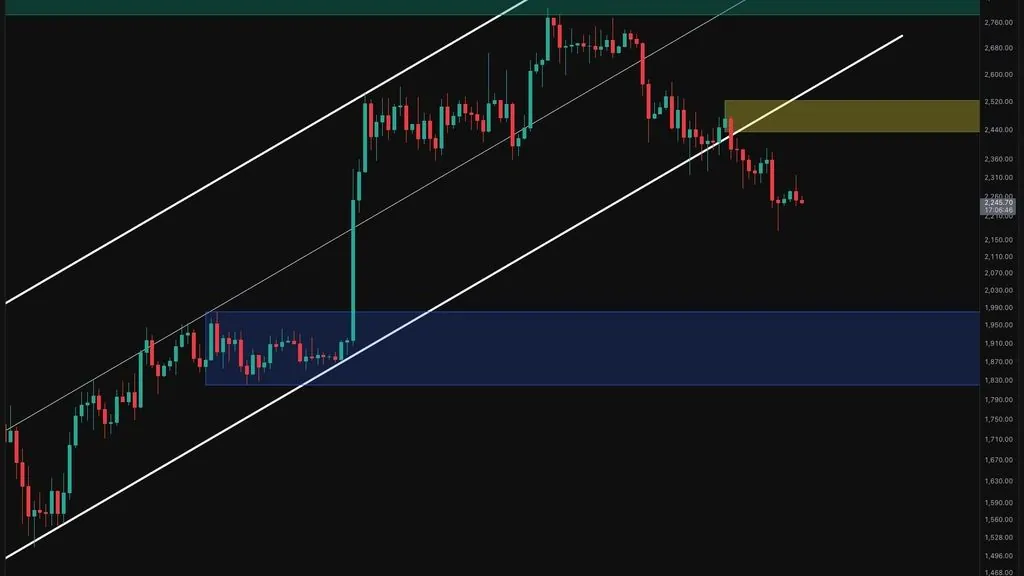
Bitcoin traded below $77,000 on Monday after failing to hold $80,000 support and failing to break above $78,500, according to Bitcoinist. CryptoPotato's daily chart analysis places spot near $77,700, below the broken midpoint of an ascending channel that had supported the September advance. The two outlets report slightly different intraday levels, which reflects the timing of their chart snapshots rather than a disagreement about the trend.
The main defensive area both outlets identify is a $75,000-$78,000 daily demand zone. CryptoPotato's four-hour view narrows the immediate floor to $74,900-$76,300, with consolidation near $77,300 after a sharp breakdown from $79,800. Resistance is seen at $78,000-$78,300 and then at an overhead supply band of $79,800-$81,900.
On-Chain Cost Basis
CryptoPotato's on-chain analysis, drawing on UTXO age band data, indicates that the 1-to-3-month holder cohort has a realized price of roughly $76,000-$76,500. With spot near $77,300, that group is close to aggregate breakeven. A sustained move below that cost basis would place them in aggregate unrealized loss, which the article suggests could increase selling pressure from more sensitive holders.
The 6-to-12-month cohort's realized price, around $84,000-$85,000, sits above spot and could become a recovery hurdle if those holders sell into a rebound. The analysis also cautions that realized price alone does not guarantee support.
Macro Backdrop
Bitcoinist attributes part of Monday's weakness to macro conditions. Oil prices fell sharply, reportedly about 7%, on hopes of a diplomatic resolution to the US-Iran conflict, yet Bitcoin did not follow that move higher. The outlet's analysts warned that a break below $76,000 could extend the decline if bearish momentum persists. The two sources do not address the causal link between oil and crypto prices directly, so the relationship should be treated as observed rather than established.
What Would Change the Picture
Both sources frame the bearish case as dominant while price remains beneath the lost levels. A sustained close below $75,000 would expose the channel's rising lower boundary near $72,000-$73,000, according to CryptoPotato. A reclaim of $81,000 would weaken the immediate bearish structure. Traders are watching whether the $75,000-$78,000 zone and the $76,000 cost basis hold together, since a failure at both would remove the two nearest supports at once.
Why It Matters
For Traders
A close below the $75,000-$76,000 zone would open a test of $72,000-$73,000, so position sizing and stop placement around those levels matter in the next 24-72 hours.
For Investors
Holder cost basis clustering near $76,000 and $84,000-$85,000 suggests the recovery from earlier highs faces layered supply, a structural factor for multi-month positioning.
For Builders
Protocols and dashboards that rely on realized price cohorts or price-level alerts should re-check thresholds, since several key levels are clustering within a narrow band.
This article is for information only and is not financial advice. Read the full disclaimer.