Bitcoin Tests $68K as Analysts Split Over Whether the 200-Week Average Marks a Floor
Bitcoin traded near $69,200 after touching a low near $67,920, testing its 200-week moving average and channel support. Technical analysts disagree on whether the level will hold, with some calling a bottom and others warning of a breakdown toward $60,000.
Written by CoinArticle’s AI Newsroom · from 2 cited sources. How we work
Price Action Near Channel Support
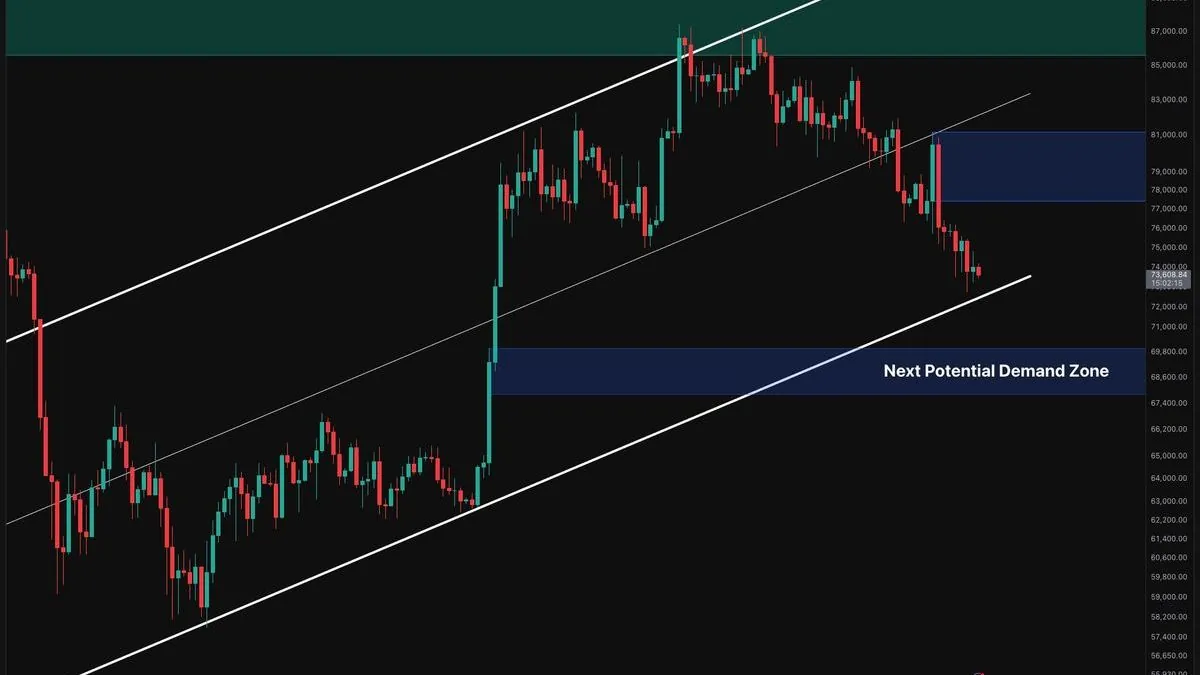
Bitcoin was trading near $69,200 at the time of writing, down roughly 6% over 24 hours, after touching a daily low near $67,920 per crypto.news price data. CryptoPotato's daily chart shows the asset approaching the lower boundary of a broader ascending channel around $70,000 to $71,000, following a failed recovery toward $81,000 and a decline of roughly $10,000 over the week.
The two sources frame the same zone differently. CryptoPotato identifies $67,800 to $69,800 as the next substantial horizontal demand zone if the channel breaks on a sustained daily close, a range tied to August's upward expansion. Crypto.news places the key area at the 200-week moving average near $68,013, which it describes as the level analysts are watching most closely.
Where Analysts Disagree on the Floor
The most direct bullish case came from analyst Doctor Profit, who wrote in a November 13 X post that "Bottom was in at 68k" and said he was placing substantial buy orders. He argued the weekly 200-period moving average has marked each bear-market low over the past decade, in step with the four-year cycle, and pointed to a Fibonacci area he called the Golden Pocket between $68,000 and $69,000. He also acknowledged a losing long taken near $80,000.
Daan Crypto Trades took a more cautious view. He said Bitcoin returned to its weekly 200-period simple and exponential averages earlier in the cycle than he expected, and that the low-to-mid $70,000 range had offered less support than he anticipated. He stressed that weekly closes, not intraday wicks, will determine whether the level holds. Merlijn The Trader set a lower invalidation point, stating a weekly close below $60,000 would end his bullish scenario, based on a 2023 pattern that projected a retracement near $68,000.
Peter Schiff took the opposite position, calling Bitcoin in a long-term bear market after it traded near its November 2021 peak of roughly $69,000. The sources do not agree on whether that prior-high retest is itself meaningful support or simply a reference point.
Technical Levels and Market Context
CryptoPotato reports that Bitcoin has formed lower highs and lower lows after losing the channel midpoint. Recovery needs to clear $75,000 to $76,000 before the broader $77,400 to $81,000 supply zone becomes the main test. On the four-hour chart, the broken descending channel is acting as resistance around $74,200 to $74,500.
Futures activity has also picked up. CryptoPotato's Futures Volume Bubble Map shows a cluster of heating readings during the decline from about $76,000 toward $74,000, a shift from the mostly neutral readings of the prior correction. The author notes the metric cannot distinguish aggressive selling, hedging, and liquidations from buyers absorbing supply, and that the readings remain in the heating category rather than overheating.
The sources differ on how much weight the support test deserves. Crypto.news treats the 200-week average as a historically reliable signal, while CryptoPotato describes the channel break as a structural risk requiring confirmation. Both agree that a single touch of a long-term average does not establish that a selloff has ended.
What to Watch Next
The immediate questions are whether Bitcoin closes a week above the 200-week average and whether the daily channel boundary holds. A sustained daily close below the channel would shift attention to the $67,800 to $69,800 zone, while a recovery through $75,000 to $76,000 would ease pressure in the short term. Neither source provides a timeline for either outcome.
Why It Matters
For Traders
A weekly close below the 200-week average near $68,000 would put the $67,800 to $69,800 demand zone in play, while holding above $75,000 would ease near-term pressure.
For Investors
Whether the 200-week average holds as a floor will be a key test of the four-year cycle pattern that long-term bulls cite for this bear market.
For Builders
Heating futures readings near lows suggest elevated liquidation risk, so protocols with leverage or liquidation logic should stress-test positions near $68,000.
This article is for information only and is not financial advice. Read the full disclaimer.