Bitcoin Holds $75K Support as ETF Outflows and $14B Liquidation Setup Pressure Market
Bitcoin trades near $77,400 after a roughly two-week consolidation between $75,000 and $80,000, while spot ETF outflows and a concentrated long-liquidation cluster near $72,000 to $74,000 add downside risk. Analysts disagree on whether the current support is organic or propped up by short squeezes.
Written by CoinArticle’s AI Newsroom · from 2 cited sources. How we work
Price Holds Range, But Levels Are Contested
Bitcoin was trading around $77,300 to $77,400 at the end of the week, according to CryptoPotato and CryptoSlate, after briefly clearing $82,000 earlier this month. Both sources describe a market that has been range-bound for nearly two weeks between roughly $75,000 and $80,000. The sources differ on what the current levels mean. CryptoPotato reads the $75,000 zone as holding on organic buying, while CryptoSlate frames the same area as a pivot where leveraged positioning could decide the next move.
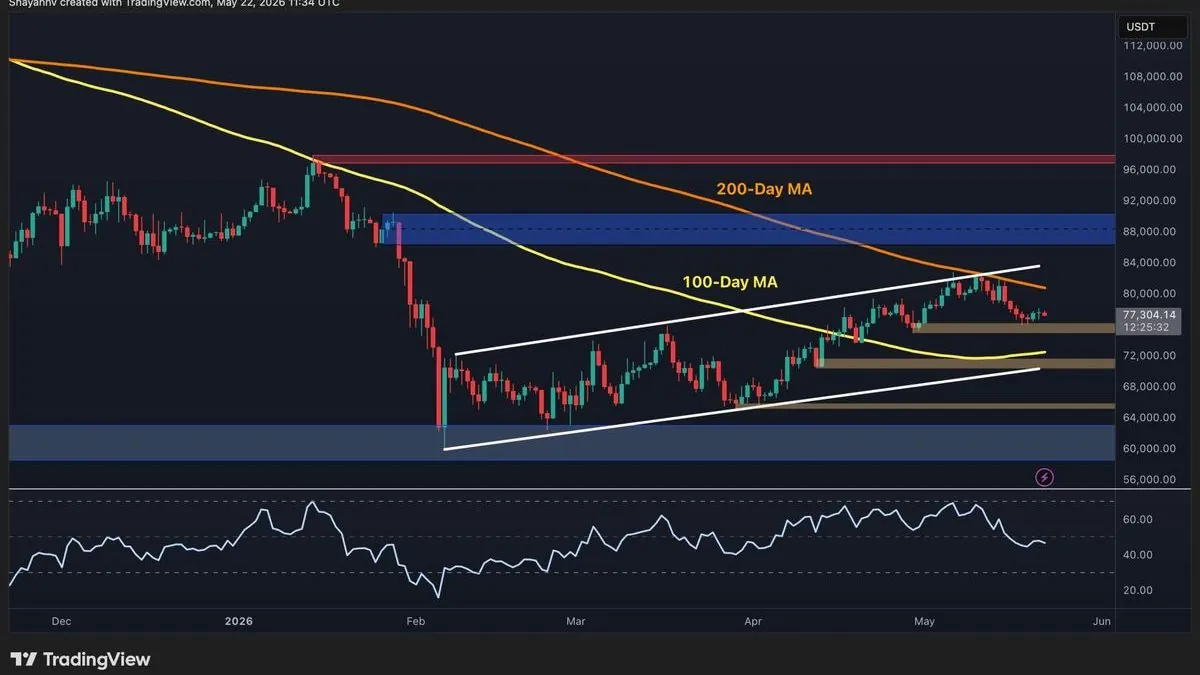
CryptoPotato's daily analysis places the macro framework in an ascending channel from February, with the lower boundary rising toward $72,000 and the 100-day moving average sitting just above that zone. It identifies a daily close above $80,000 as needed to rebuild the bullish case, and a daily close below $72,000 as structural damage that would put the $60,000 demand zone back in play. On the 4-hour chart, it flags $78,200 as the immediate resistance, with a close above $78,000 as the first sign of a rebound.
Derivatives Positioning and Liquidation Risk
CryptoSlate, citing Alphractal's aggregated liquidation heatmap, estimates about $14.3 billion in potential liquidation pressure around the current price. The firm reports $1.61 billion in resting long liquidations near $73,716, rising to $7.14 billion if price touches $72,122. Short liquidations are more dispersed, with $1.66 billion at $78,786 and roughly $7.20 billion not reached until about $88,202.
CryptoPotato's read of derivatives data is more constructive. Its funding rate reading of +0.004 is modest, and it argues the deeply negative funding that fueled the rally from $60,000 to $80,000 has largely been exhausted. Its interpretation is that recent support is being defended by spot buyers rather than forced short covering. This is the central disagreement between the two pieces: CryptoSlate treats the long-side cluster as a live downside accelerant, while CryptoPotato treats the absence of short-squeeze fuel as evidence of more durable demand. The sources do not reconcile the two views, and the liquidation figures cited by CryptoSlate come from a single analytics provider.
Spot Demand Is Weakening
The most consistent signal across both sources is softening spot demand. CryptoSlate reports about $2.26 billion in net outflows from US spot Bitcoin ETFs over two weeks following the move above $82,000, with rolling 30-day flows back in negative territory according to Ecoinometrics. CryptoQuant's Apparent Demand metric, which compares new issuance with coins inactive for more than a year, fell to -147,000 BTC, its weakest reading of the year.
CryptoPotato does not address ETF flows or on-chain demand directly, so its bullish reading rests on derivatives and price structure rather than the spot indicators CryptoSlate cites. Readers should weigh the two perspectives accordingly: the spot-demand data points in one direction, while the technical and funding data as read by CryptoPotato point more neutrally.
What to Watch
The near-term levels named across both sources cluster between $72,000 and $80,000. A sustained break below $75,000 would test the long-liquidation cluster that CryptoSlate highlights, while reclaiming $78,000 to $80,000 would be the first confirmation cited by CryptoPotato that the rebound has momentum. Continued ETF outflows would weaken the case for a sustained recovery in either framing.
Why It Matters
For Traders
A break below $75,000 could trigger a long-liquidation cascade near $72,000 to $74,000 per Alphractal's heatmap, while a reclaim of $78,000 to $80,000 would be the first sign of spot-driven strength.
For Investors
Two weeks of net ETF outflows and negative 30-day flow trends suggest institutional demand has stopped cushioning the market, which matters more for multi-month positioning than short-term price moves.
For Builders
Liquidation clustering data from a single analytics provider is being used to model downside risk, so protocols relying on liquidation thresholds should verify these levels against exchange-level data before depending on them.
This article is for information only and is not financial advice. Read the full disclaimer.