Solana Falls Below $100 as Spot ETF Outflows and Whale Selling Mount
Solana traded near $100 after U.S. spot SOL ETFs recorded $24.82 million in net outflows over two sessions in late October, according to SoSoValue data. A separate Lookonchain report of a wallet selling 1.02 million SOL added to selling pressure, though sources differ on the timing and scale of recent losses.
Written by CoinArticle’s AI Newsroom · from 2 cited sources. How we work
Price and Flows in Late October
Solana fell below $100, trading at $99.71 at the time of reporting, down 2.1% over 24 hours and 15.41% over the month, according to crypto.news. Daily volume stood at roughly $2.93 billion.
U.S. spot SOL exchange-traded funds recorded $24.82 million in net outflows over two sessions, per SoSoValue data cited by crypto.news: $19.16 million on October 27 and $5.66 million on October 28. The October 27 redemption was the largest single-day outflow since December 3, 2025, when the funds lost $32.19 million. Crypto.news reports that October's ETF outflows exceeded $105 million, while cumulative net inflows remain positive at about $1.51 billion, with net assets near $1.56 billion on October 28.
Whale Selling and Disputed Timeline
Blockchain analytics account Lookonchain reported on October 29 that a wallet linked to an Arkham-tracked entity sold 1.02 million SOL, worth about $104.3 million, over five days. The wallet owner's identity and full execution details have not been independently verified, and neither source establishes how much of the price decline came from this activity versus ETF redemptions.
The Defiant reports a broader and later window: Solana lost 22.9% over 28 days and hit a four-week low, with further Solana ETF withdrawals recorded on November 6 and November 9. The two reports therefore describe different periods. Crypto.news frames the late-October outflows as the immediate pressure point, while The Defiant's figures extend into early November. Readers should treat the monthly loss figures (15.41% versus 22.9%) as measuring different windows rather than conflicting measurements of the same period.
Market Structure and Technical Levels
Solana's market capitalization was near $58.83 billion, seventh among cryptocurrencies, with about 589.98 million tokens circulating out of 636.64 million total. Crypto.news reports that the CoinMarketCap Altcoin Season Index fell 5.08% to 56, pointing to softer demand across alternative tokens.
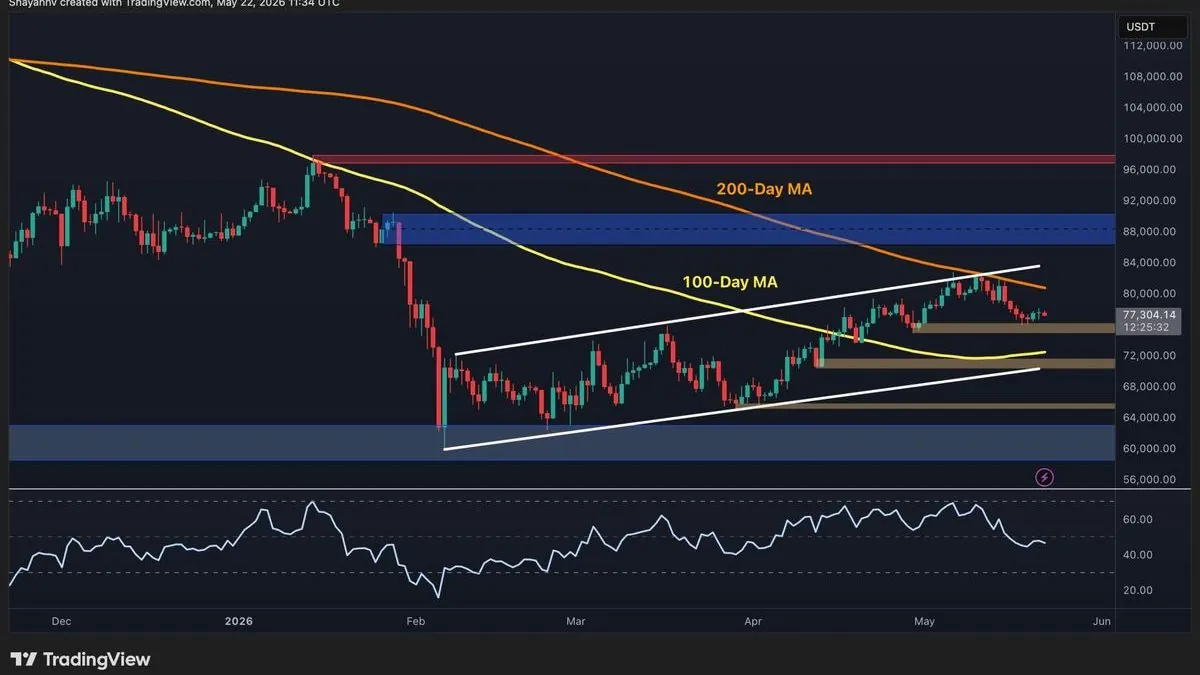
TradingView indicators placed SOL below the 20-day Bollinger Bands midpoint at $104.46, with the lower band near $98.73. The Bollinger Band Power reading was -4.70 and the seven-day RSI 34.81, both signaling weak momentum. Analyst CryptoBusy identified $96 to $100 as key support on the four-hour chart, and said buyers would need a confirmed move above $104 to $105 to challenge resistance between $108 and $112.
Adoption Signals Diverging From Price
A separate report on tokenized stocks found Solana's tokenized-equity holder count reached about 1.5 million, five times its August level. Holder growth in tokenized equities is a different measure from demand for SOL itself, and it has not offset the price weakness.
Why It Matters
For Traders
Support near $96 to $100 and resistance at $104 to $105 are the levels the sources flag, and a break below support would face a weak momentum backdrop.
For Investors
Repeated ETF outflows against positive cumulative inflows suggest institutional demand is cooling without fully reversing, a pattern worth tracking over several months.
For Builders
Solana-dependent protocols should expect weaker token prices and possible lower on-chain activity while selling pressure persists, which can affect fee-based economics.
This article is for information only and is not financial advice. Read the full disclaimer.