Bitcoin Holds Near $74K-$77K as Analysts Split on Next Move
Bitcoin is trading in the mid-$70,000 range after a failed breakout above $80,000, with sources disagreeing on whether recent price levels mark a recovery. Analysts flag weak ETF demand, rising open interest and hotter inflation data as factors that could drive the next large move.
Written by CoinArticle’s AI Newsroom · from 2 cited sources. How we work
Where Bitcoin Is Trading
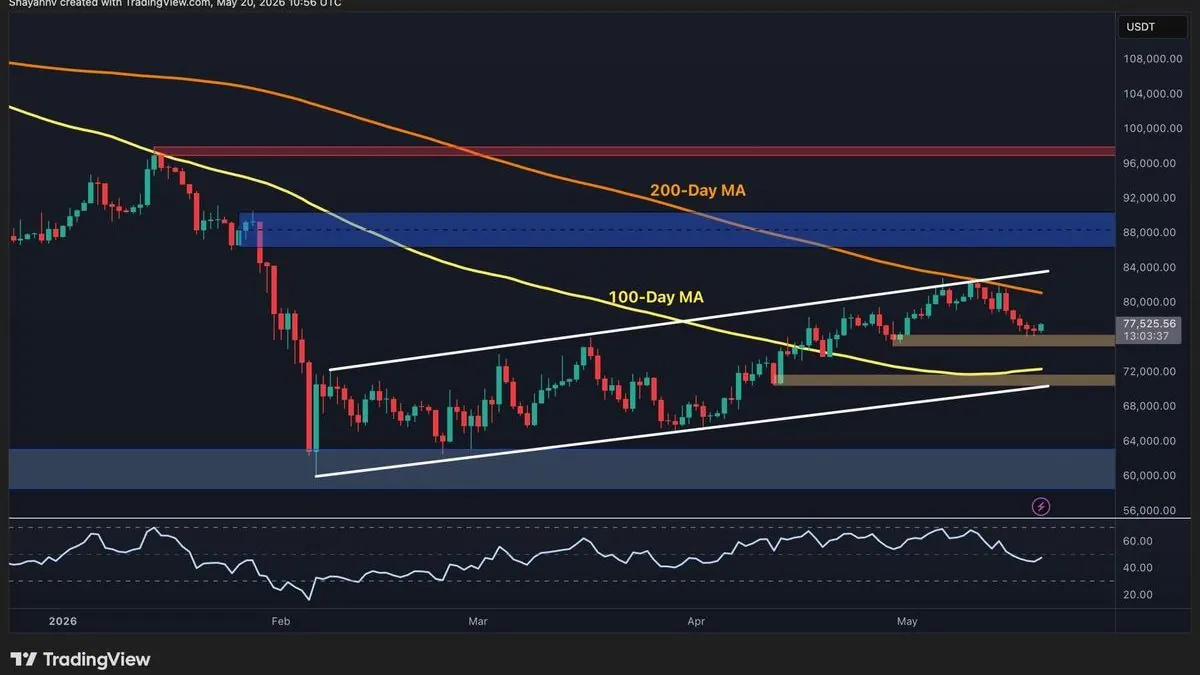
Bitcoin traded near $73,700 on November 12 according to crypto.news market data, down about 8.27% over the prior week, while CryptoPotato's analysis, published in the third week of May, put BTC at $77,500. The two reports describe different points in time and different price regimes, so their figures should not be read as a direct conflict. Both agree that Bitcoin failed to hold above $80,000 and has since traded in a range below it.
Technical Picture: Support and Resistance
CryptoPotato identifies a $75,000-$76,000 support zone, with the 100-day moving average sloping up toward roughly $72,000, and a bearish fair value gap near $80,000 that it expects price to revisit. Its scenario treats a daily close below $75,000 as the first serious structural damage, with $70,000-$72,000 as the next demand zone. Bitfinex, cited by crypto.news, instead points to $75,717 as the short-term holder cost basis, a level where recent buyers may sell after breaking even. Both reports place the $75,000 area as pivotal, though they frame it through different indicators.
Flows and Positioning
Crypto.news reported that US spot Bitcoin ETFs recorded $95 million in net outflows on Tuesday, a fourth straight session of outflows, and that roughly $2.22 billion left the funds across eight sessions beginning October 30, according to a November 11 Bitfinex assessment. On derivatives, CryptoQuant analyst BaykusCharts found Binance open interest fell from $9.4 billion to $7.2 billion since mid-October, but estimated only about 12% of positions had closed in Bitcoin terms, with funding rates still positive. Trader Daan Crypto Trades noted that open interest measured in BTC has returned to levels last seen between 2021 and 2023, and said such periods often preceded a flush but did not consistently point in one direction.
Macro and Supply Signals
US consumer prices rose 0.4% in October against economists' expectations of 0.3%, raising the probability traders assign to another Federal Reserve rate increase in December. CryptoQuant analyst Arab Chain reported that miner reserves had fallen to approximately 1.19 million BTC, their lowest level since 2009, while exchange deposits have climbed.
Analyst Disagreement
CryptoPotato's on-chain reading, based on Net Unrealized Profit/Loss at 0.29, argues the market is past capitulation with most of the cycle's gains still ahead. Bitfinex and crypto.news sources take a more cautious view, arguing the latest correction has not cleared enough leveraged positions to support a lasting recovery. These are interpretations of overlapping data rather than conflicting measurements.
Why It Matters
For Traders
The $75,000-$76,000 zone and the $75,717 cost basis are the levels both sources identify as decisive for the near-term direction of price.
For Investors
Sustained spot ETF outflows and a hawkish rate outlook would weigh on institutional demand, a factor that has to reverse before any multi-month recovery case strengthens.
For Builders
Rising open interest and positive funding rates indicate heavy leverage in the market, which increases the importance of liquidation-aware risk and collateral design.
This article is for information only and is not financial advice. Read the full disclaimer.