Bitcoin Retreats to $78K as Traders Split Between Bear Trap and Chop Range Reads
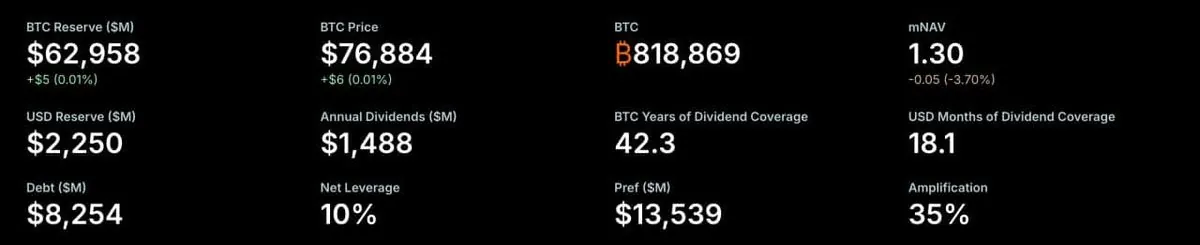
Bitcoin traded near $78,000 on Nov. 5 after failing to hold $80,000, down about 3% on the day according to Binance BTC/USDT data on TradingView. Analysts disagree on whether the dip is a bear trap or a prolonged chop range, with negative funding rates and rising open interest cited on one side.
Written by CoinArticle’s AI Newsroom · from 2 cited sources. How we work
Price Action and Key Levels
Bitcoin fell to around $78,000 on Nov. 5 after briefly recovering above $81,000, down 3.11% over the daily session on Binance BTC/USDT data displayed on TradingView. The weekly range ran from a high of $81,196 to a low of $75,736, and buyers have so far been unable to reclaim $80,000 as a sustained level.
On the daily chart, price remains inside a descending channel drawn from late-September and early-October highs, with each rebound stalling at a lower level. The 20-day moving average sits at $80,139 according to Bollinger Band readings, and the lower band near $76,059 along with the $75,736 weekly low define the nearest downside zone. The daily Relative Strength Index stands at 42.93, below neutral but above its recent average.
The Bear Trap Argument
Pseudonymous analyst Cryptic Trades argued on X that the decline may be a trap for short sellers. The core of the case is a divergence between price and Open Interest, which measures outstanding derivative contracts: while BTC fell toward $78,000, Open Interest kept rising. Such divergences are often read as a sign of a possible trend reversal.
The same analyst pointed to negative Funding Rates, which indicate short traders are paying to remain positioned. He characterized this as bears "doubling down," a setup he said can precede a short squeeze if forced position closures push prices higher. He also noted that the broader market structure remains intact.
The Chop Zone View and Opposing Signals
Not all read the setup as bullish. Analyst Altcoin Sherpa called the current area a "chop zone" and said he expected several more weeks of uneven trading, identifying $90,000 and $75,000 as the boundaries needed for a decisive move. Trader Merlijn The Trader had outlined a more immediate bullish target of $81,000 following a double-bottom pattern, with $80,000 as the line that needed to hold. That condition was not met in the afternoon session, which weakens the near-term version of that thesis.
The weekly chart gives a mixed picture. Chaikin Money Flow reads 0.11, above zero, and the Awesome Oscillator remains positive at 8,146.88, though its recent histogram bars have turned red and shortened. Neither indicator confirms a bottom, and the weekly candle was still open at the time of the chart snapshot.
Flows and Context
U.S. spot Bitcoin ETFs recorded $115.6 million in net withdrawals on Nov. 3, bringing outflows above $1.15 billion across three sessions, following an election-related selloff. Bitcoin had recovered above $78,000 on Nov. 4 before the latest pullback. CoinGlass's one-week liquidation heatmap shows concentrations of liquidation exposure around $79,000 to $80,000, a zone that may be tested in the coming sessions.
Why It Matters
For Traders
A close back above the $80,000 moving average would be the first concrete sign against the descending channel, while a break below $75,736 would expose the channel's lower boundary near $73,000.
For Investors
Sustained ETF outflows alongside a range-bound price suggest institutional demand has not yet re-accelerated, so the multi-month trend will depend on whether flows turn positive.
For Builders
Divergence between rising open interest and falling price, plus heavy negative funding, makes derivatives-facing protocols worth stress-testing against sharp short squeezes or liquidation cascades near $79,000 to $80,000.
This article is for information only and is not financial advice. Read the full disclaimer.