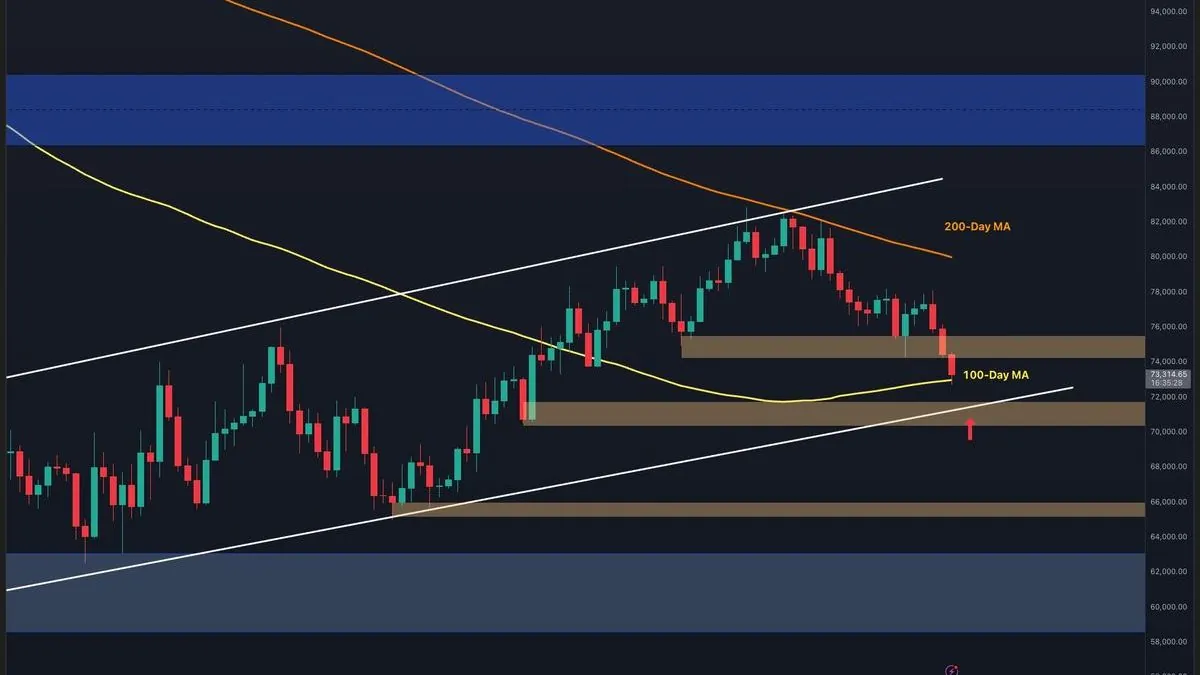
Bitcoin Tests $70K-$72K Support After Losing $75K Zone as ETF Inflows Stall
Bitcoin has broken below the $75K-$76K support zone and is approaching a cluster of technical supports between $70K and $72K, according to two technical analyses. Analysts say weakening spot ETF inflows and a bearish short-term structure leave downside risk elevated, with the sources differing on how far prices could fall.
Written by CoinArticle’s AI Newsroom · from 2 cited sources. How we work
Where Bitcoin Is Trading
Bitcoin has moved below the $75,000-$76,000 zone that had acted as support, and both technical analyses in this report describe the move as a breakdown. CryptoPotato's daily chart analysis says the break confirms bearish continuation after repeated failures to reclaim the descending 200-day moving average near $80,000-$81,000. NewsBTC's hourly chart work shows Bitcoin falling below $72,500 and trading under its 100-hour simple moving average, with a low of $70,581 printed on its chart.
The two sources agree on the overall direction but not on the exact level that matters most. CryptoPotato points to $70,000-$72,000 as a confluence of supports, including a rising trendline, the 100-day moving average near $73,000, and a historical order block. NewsBTC places its immediate support at $71,200, with a first major support at $70,500 and a further level near $70,000. The disagreement reflects different timeframes: the daily view treats the $70,000-$72,000 band as a single zone, while the hourly view sees it as a series of narrower levels.
Levels Each Source Is Watching
CryptoPotato describes a relief bounce as possible if buyers defend $70,000-$72,000, with a recovery toward the broken $75,000-$76,000 resistance. It says failure to hold would open a path to $65,000-$66,000 and potentially a $60,000-$63,000 demand region. Its 4-hour analysis adds that a bounce could reach $74,000-$76,000 before sellers return.
NewsBTC frames the upside more narrowly. It lists immediate resistance near $71,950, then $72,350 (the 50% Fibonacci retracement of the move from $74,161 to $70,581), then $73,500 and $74,000, with $75,000 as the next barrier for buyers. On the downside, it says a break of $70,000 could send the price toward $68,800, with $68,500 as the main support below which recovery could be difficult in the near term. Momentum indicators in that analysis point the same way: hourly MACD is gaining pace in bearish territory and hourly RSI sits below 50.
Institutional Demand and Outlook
CryptoPotato links the price weakness to spot Bitcoin ETF flows. Its cumulative flow chart shows inflows flattening and recently turning weaker during the latest correction, while price recovery attempts have not been matched by a pickup in ETF buying. The source argues that this divergence suggests institutional demand has cooled and partly explains why Bitcoin has struggled to hold rallies above $80,000-$82,000. NewsBTC does not address ETF flows; its analysis is confined to price action and standard indicators.
The two sources do not share a single view of what happens next. CryptoPotato holds that the overall market structure stays bearish unless Bitcoin reclaims and stabilizes above $75,000-$76,000, and says a recovery in ETF flows alongside stability at $70,000-$72,000 could restore momentum later. NewsBTC's view is conditional on the hourly range: it says the price could attempt a fresh increase if it stays above $70,000, but could resume declining if it fails below $72,500.
Both analyses are technical and neither is a forecast with a stated probability. The levels cited are the authors' reading of the charts and should be read as reference points rather than predicted outcomes.
Why It Matters
For Traders
Bitcoin's reaction to the $70,000-$72,000 band will be the near-term test, with the sources disagreeing on whether it is a single zone or a sequence of narrower levels.
For Investors
Flattening spot ETF inflows during the decline suggest weaker institutional demand, a factor to watch alongside whether Bitcoin can reclaim $75,000-$76,000.
For Builders
Products and dashboards that track spot ETF flow data against price may need to account for periods where the two diverge, as these sources describe.
This article is for information only and is not financial advice. Read the full disclaimer.