Ethereum Slides Toward $2,100 as Support Breaks and ETF Outflows Persist
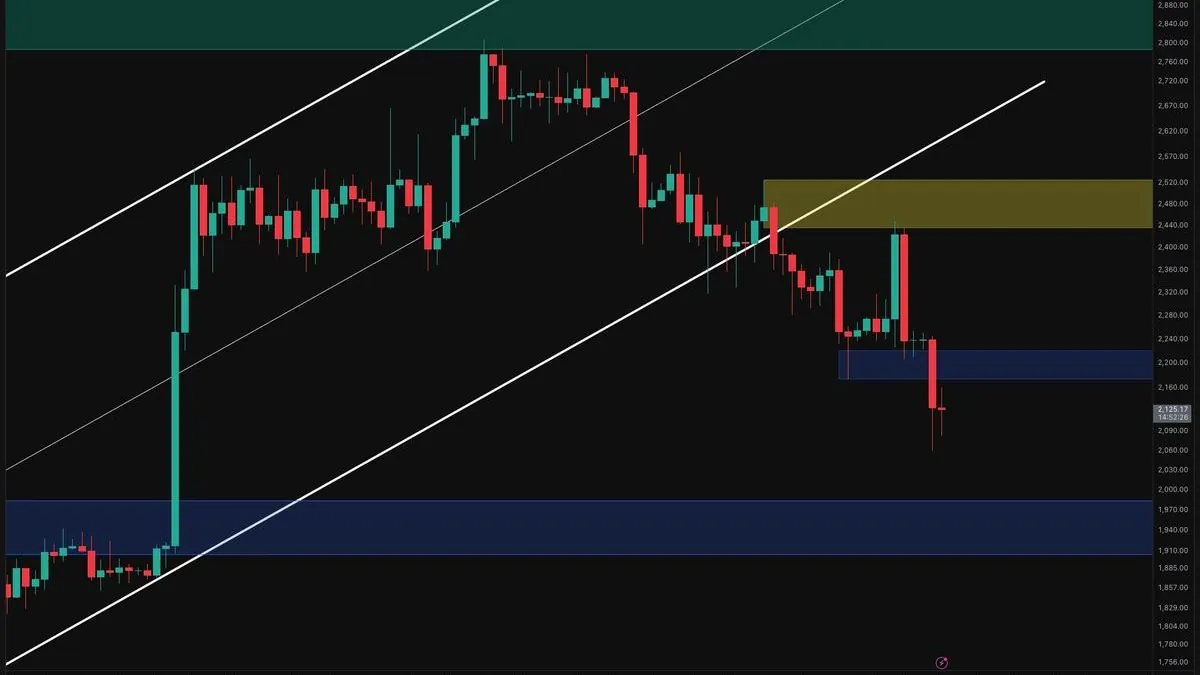
Ethereum traded near $2,129 on Wednesday, roughly 12% below its recent local high, after breaking an ascending channel and falling beneath the $2,170 to $2,220 support zone. Sources differ on how far the decline has run and on the strength of the bearish signals, though both point to a weakened technical structure.
Written by CoinArticle’s AI Newsroom · from 2 cited sources. How we work
Price Action and Key Levels
Ethereum traded near $2,129 at the time of reporting, down about 12% from a recent local high near $2,420, according to Crypto.news. CryptoPotato put the same price near $2,130 after a 5% drop, and describes the breakdown as moving below a $2,170 to $2,220 support zone. The two accounts agree on direction and on the price level, though they frame the zone differently: Crypto.news identifies $2,000 as the key psychological level to defend, while CryptoPotato treats the $2,170 to $2,220 band as the first test for any recovery and flags $2,060 as the immediate downside reference.
Both sources describe a failed rebound. Crypto.news says resistance near $2,280 to $2,320 repeatedly stopped recovery attempts, and that the daily close fell below the lower boundary of a multi-month ascending channel and the 20-day exponential moving average. CryptoPotato reports a rally toward $2,440 that was rejected at a $2,440 to $2,520 supply zone, followed by a move back inside a descending channel on the four-hour chart. The analyses weigh the same evidence differently, and the disagreement matters for the downside case: Crypto.news cites a $1,800 risk level, while CryptoPotato points to $1,900 to $1,980 as the broader daily demand zone below $2,000.
Macro and Risk Backdrop
Crypto.news attributes the selloff to a jump in U.S. 10-year Treasury yields to 4.58%, their highest level in months, following hotter-than-expected inflation data. The same source links the decline to renewed tariff tensions after a 15% global tariff package, and to weakness in AI and semiconductor stocks. Ethereum's historically strong correlation with the Nasdaq is cited as a reason for its particular exposure. Bitcoin also slipped below short-term support, according to the same report.
CryptoPotato's analysis is technical and does not address these macro inputs directly. The two accounts therefore describe the same price move from different angles, and the macro explanation rests on Crypto.news alone.
Institutional Flows and On-Chain Signals
Crypto.news reports persistent net outflows from U.S. spot Ethereum ETFs over recent weeks, with several funds posting consecutive days of redemptions. It attributes part of the weak demand to the absence of native staking rewards in approved products. BitMEX co-founder Arthur Hayes is quoted saying that until staking is integrated, "capital allocation will remain skewed toward Bitcoin." The same report cites Glassnode data showing the number of wallets holding more than 10,000 ETH at its lowest level in nearly ten months, and centralized exchange net inflows at their highest since early 2025.
CryptoPotato does not cover ETF flows or on-chain holder data. Its only derivatives observation concerns funding. The 14-period exponential moving average of ETH funding remains positive, meaning longs are still paying shorts on average, and its rebound in early November did not coincide with a sustained price recovery. CryptoPotato says this divergence suggests bullish perpetual positioning has persisted even as spot weakened, while cautioning that positive funding alone does not establish excessive leverage.
What to Watch
The sources converge on the same near-term question: whether ETH can reclaim the $2,170 to $2,220 zone and hold above $2,000. CryptoPotato identifies a reclaim as the signal that would ease selling pressure and open a path toward $2,280 to $2,360. A rejection from that zone, or a sustained move below $2,060, would raise the risk of a test of $2,000 and the lower demand band. Crypto.news's more bearish target of $1,800 is not supported by the technical levels cited in CryptoPotato, and readers should treat it as the outlier scenario of the two accounts.
Why It Matters
For Traders
Whether ETH reclaims the $2,170 to $2,220 zone or loses $2,060 in the next few sessions will decide whether the current breakdown holds or extends.
For Investors
Persistent ETF outflows and falling large-holder counts suggest institutional demand for ETH remains weaker than for Bitcoin until staking-related product changes are in place.
For Builders
Products and protocols whose demand assumptions rely on near-term ETH ETF inflows or staking-linked yield should stress-test those assumptions against the current outflow trend.
This article is for information only and is not financial advice. Read the full disclaimer.